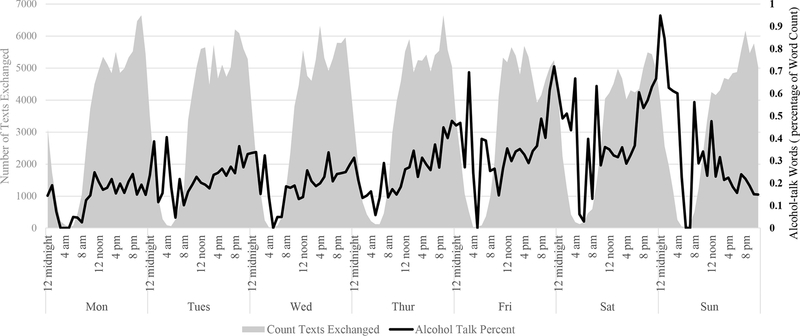
Figure 2. Number of Texts and Alcohol Talk by Hour of Day and Day of Week.
Note. Plot of alcohol talk in all text messages over the study period (569,172 text message observations across 267 participants). The dark black line (with values on the right axis) depicts alcohol-talk as a percentage of words exchanged by hour. The grey region (with values on the left axis) depicts the total number of texts exchanged by hour.

