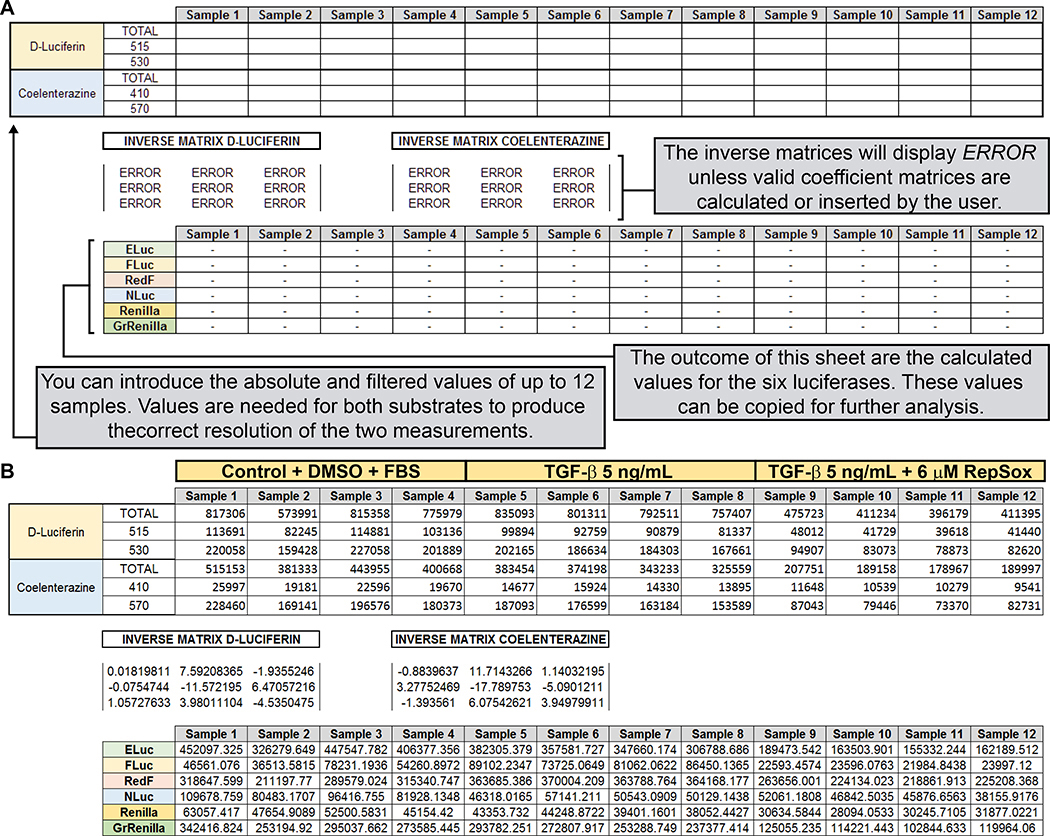
Figure 11. Calculation of spectrally unmixed values for the six luciferase values obtained for the experimental manipulations during the TGFβ/RepSox experiment.
(A) Screenshot of the third worksheet of the provided Microsoft Excel template (see Supplemental File), including simplified instructions on how to generate output values for the six luciferases from the measured values generated by the plate leader. This worksheet is prepared to process up to 12 samples. A fourth worksheet, able to process an entire 96-well plate, is provided separately (not shown) in the Microsoft Excel template. (B) Real example of the automatic calculation of the spectrally unmixed values for each luciferase, after the introduction of the luminescence values of 4 replicates for each experimental condition.

