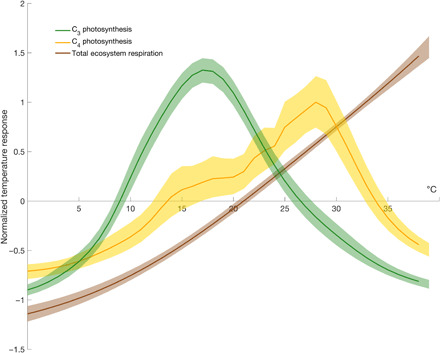
Fig. 1. Temperature dependence of global carbon fluxes.

The normalized global temperature response of C3 photosynthesis (green), which exhibits of 18°C, C4 photosynthesis (yellow) that exhibits at 28°C, and total ecosystem respiration (brown) derived from the FLUXNET 2015 synthesis dataset. The minor thermal optima observed in C4 classified sites validate the mixed C3/C4 nature of some ecosystems and were well explained by the sum of two Gaussian curves (see Materials and Methods). All fluxes were normalized and fit over ambient temperatures observed by FLUXNET (up to 38°C), where the mean across each curve sums to zero. Shaded areas represent the 90% confidence interval of projections.
