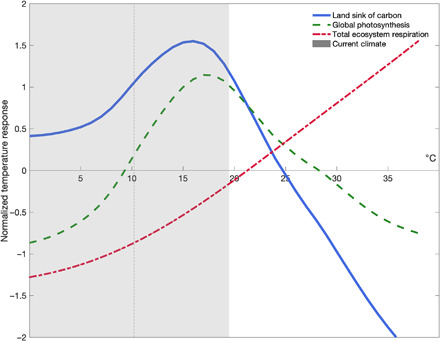
Fig. 2. Temperature dependence of the terrestrial carbon sink.

Integrated global temperature response curves for normalized photosynthesis (green dashed line), respiration (red dashed dotted line), and a mass balance estimate of the land sink (blue solid line) in relation to current climate (gray bar), where the mean across each curve sums to zero. Photosynthesis represents the integration of C3 and C4 curves (Fig. 1) weighted by global fraction of C3/C4 photosynthesis (37). The gray shaded bar represents observed mean annual temperature range from 1991 to 2015 (9, 22), and vertical dashed line indicates current annual mean temperature at FLUXNET tower sites.
