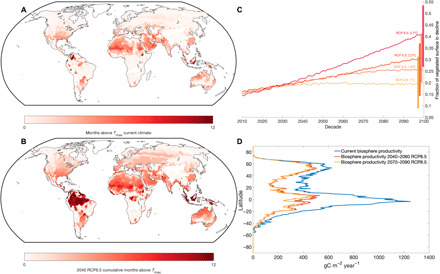
Fig. 3. Spatial patterns of temperature tipping points for the biosphere.

(A) Current cumulative monthly dose of temperature above by biome (see Materials and Methods) based on 1950–2010 WorldClim data (22). (B) Cumulative temperature dose above under Representative Concentration Pathway 8.5 (RCP8.5) by 2040–2060 based on WorldClim data (22). (C) Cumulative fraction of terrestrial biosphere in exceedance of by RCP scenario based on Coupled Model Intercomparison Project Phase 5 (CMIP5) multimodel mean monthly data. Vertical bars represent an integration of the uncertainty across CMIP5 ensemble member projections for changes in temperature, translated into a range of exceedance of for the vegetated surface. (D) Current mean gridded gross photosynthesis (2003–2013) (38) along with reductions in biosphere productivity due to exceedance of Tmax for 2040–2060 (44% reduction) and 2070–2090 (49% reduction) based on Worldclim CMIP5 downscaled data (22).
