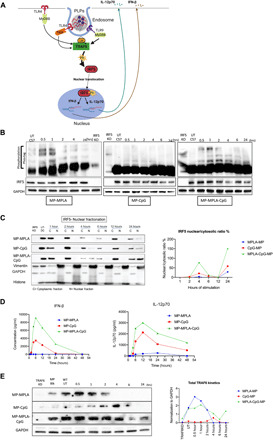
Fig. 4. Sustained IRF5 phosphorylation, higher IRF5 nuclear translocation, and elevated TRAF6 are responsible for synergistic IFN and IL-12p70 responses in BM-APCs.

(A) Schematic showing TRAF6 and IRF5 signaling following TLR4 and TLR9 activation. (B) Levels of phosphorylated (Phos-tag) and total IRF5 [SDS–polyacrylamide gel electrophoresis (PAGE)] after 0.5, 1, 2, 4, 6, and 24 hours of BM-APCs treated with MPs with MPLA and/or CpG. GAPDH (glyceraldehyde-3-phosphate dehydrogenase) was used as a loading control, and treated IRF5−/− BM-APCs were used as negative controls. (C) Total IRF5 levels in the nuclear and cytoplasmic fractions at 1, 2, 4, 6, 12, and 24 hours of BM-APC treated with MPs with MPLA and/or CpG. Ratio of nuclear-to-cytoplasmic IRF5 after 1, 2, 4, 6, 12, and 24 hours of treatment, where a higher ratio indicates a higher rate of nuclear translocation. Ratios were performed by Bio-Rad Image Lab software. (D) Kinetics of IFN-β and IL-12p70 production by BM-APCs treated with PLPs. BM-APCs from this experiment were used for nuclear fractionation studies, and the results are shown in (C). (E) Levels of total TRAF6 (SDS-PAGE) after 0.5, 1, 2, 4, 6, and 24 hours of BM-APCs treated with MPs with MPLA and/or CpG. GAPDH was used as a loading control, and TRAF6 knocked down in BM-APCs was used as a negative control. On the right is the graphical representation of the GAPDH normalization of each blot. This was done with Bio-Rad Image Lab software.
