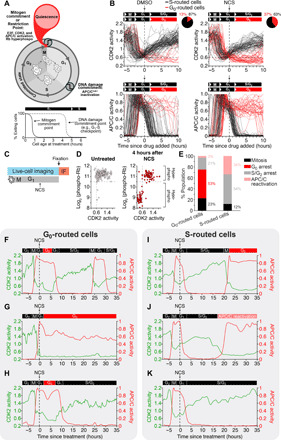
Fig. 1. Cells route to G0 rather than arresting at the G1-S transition after DNA damage.

(A) Passage through the Restriction Point in early G1 phase is characterized by hyperphosphorylated Rb, E2F-mediated transcriptional activity, CDK2 activation, and high APC/C activity. Passage through the DNA damage commitment point is characterized by rapid APC/C inactivation at the end of G1 phase. (B) Single-cell traces of CDK2 (top) and APC/C (bottom) activity in MCF-10A cells treated with DMSO or NCS (200 ng/ml) during G1 phase, which was defined as CDK2 activity greater than 0.6 and APC/C activity greater than 0.3 at the time of treatment. Cells were colored black if APC/C activity fell below 0.3, indicating entry into S phase, and cells were colored red if APC/C activity remained above 0.3 6 hours after drug addition and CDK2 activity fell below 0.6, indicating rerouting to G0. Pie chart represents the percentage of cells that either routed to S or G0 phase after DNA damage. (C) Experimental setup for (D). Live-cell imaging was conducted to identify G1 cells at the time of treatment. Cells were treated with either DMSO or NCS (200 ng/ml) and then fixed 4 hours later. IF, immunofluorescence. (D) Scatterplot of single-cell CDK2 activity in the last frame of the movie versus the phospho-Rb levels after fixation. (E) Fate outcomes of G0- versus S phase–routed cells. Cells were tracked for 48 hours after NCS treatment, and fate outcomes were manually assigned. N > 2000 cells from n = 2 experiments. (F to H) Single-cell CDK2 and APC/C activity traces for cells that routed back to G0 after DNA damage. (I to K) Example single-cell CDK2 and APC/C activity traces for cells that continued on to S phase after DNA damage in G1.
