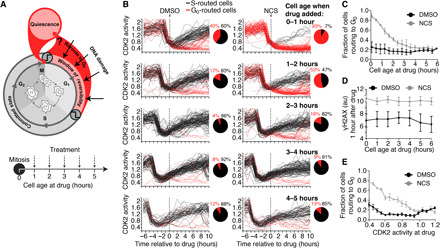
Fig. 2. Cells can reroute to G0 at any point in G1 phase.

(A) Schematic diagram of the cell cycle and the experimental setup. Asynchronous cells were treated with NCS and binned by cell age (i.e., time since mitosis at the time of treatment), and each cell’s fate was recorded. (B) Single-cell CDK2 activity traces from cells treated with DMSO (left) or NCS (200 ng/ml; right) while in G1 phase, which was defined as CDK2 activity greater than 0.6 and APC/C activity greater than 0.3 at the time of treatment. Cells were binned by cell age at the time of treatment as indicated. Cells were colored black if APC/C activity fell below 0.3, indicating entry into S phase, and cells were colored red if APC/C activity remained above 0.3 6 hours after drug addition and CDK2 activity fell below 0.6, indicating rerouting to G0. (C) Quantification of the percentage of cells that routed to G0 after treatment with DMSO or NCS (200 ng/ml) as a function of cell age at the time of treatment as described in (B). Error bars are SEM from n = 3 independent experiments. (D) Median γH2AX staining 1 hour after treatment with DMSO or NCS (200 ng/ml) binned by cell age at the time of treatment. Error bars are SEM from n = 3 independent experiments. (E) Quantification of the percentage of cells that routed to G0 binned by CDK2 activity at the time of treatment. Error bars are SEM from n = 3 independent experiments.
