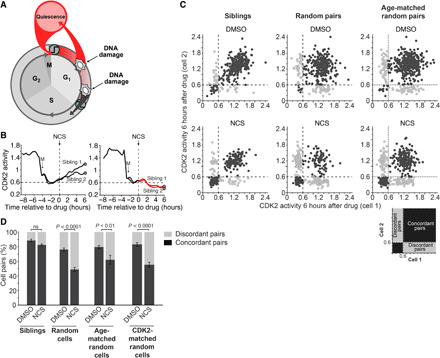
Fig. 3. The decision to route to G0 is largely deterministic.

(A) Schematic diagram of the cell cycle showing divergent fate outcomes after DNA damage. (B) CDK2 activity from two pairs of sibling cells treated with NCS (200 ng/ml) at the indicated time. The time of mitosis is indicated as M. (C) Scatterplot of the CDK2 activity from pairs of sibling cells (left), pairs of random cells (middle), or pairs of age-matched random cells (right) 6 hours after treatment with either DMSO or NCS. Cells were considered concordant if both cells in the pair had CDK2 activity either above 0.6 or below 0.6. N > 700 cell pairs per condition. (D) Quantification of pairs of cells from (C) that were either concordant or discordant. Cells were considered age-matched if they were born within 12 min of each other and were considered CDK2-matched if they had CDK2 activity within 0.05 of each other at the time of treatment. Error bars are SEM from n = 3 independent experiments. P values were calculated using Fisher’s exact test. ns, not significant.
