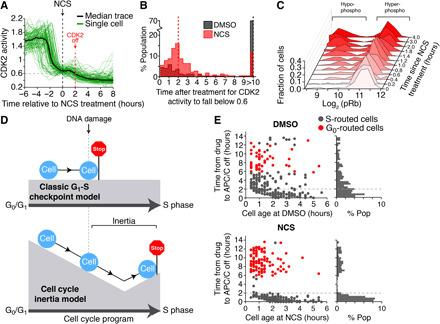
Fig. 4. Persistent CDK2 activity after DNA damage leads to S phase entry if a cell is within 2 hours of S phase.

(A) Median and single-cell traces of CDK2 activity for cells treated with NCS during G1 phase. Small vertical dashed line indicates the time when median CDK2 activity falls below 0.6 after NCS treatment. N = 104 cells. (B) Histogram of time when CDK2 activity falls below 0.6 after the indicated treatment. Note that 70% of DMSO-treated cells did not fall below 0.6 during the imaging period. Single-cell data pooled from n = 3 independent experiments. (C) MCF-10A cells were preimaged using time-lapse microscopy to establish cell age and cell cycle phase. Cells were then treated with NCS (200 ng/ml) at various times before fixation. Cells were then immunostained for phospho-Rb (S807/S811). Only cells that were between 0 and 3 hours old at the time of treatment were analyzed. Data are histograms of the single-cell log2 phospho-Rb levels at each time point. Representative histograms from n = 3 independent experiments. (D) Schematic explaining the concept of cell cycle inertia and comparing it to the classical view of the G1-S checkpoint. (E) Scatterplot of single cells comparing cell age (i.e., time since mitosis) at the time of treatment versus the time after treatment when cells inactivate the APC/C. Cells were colored black if APC/C activity fell below 0.3, indicating entry into S phase, and cells were colored red if APC/C activity remained above 0.3 6 hours after drug addition and CDK2 activity fell below 0.6, indicating rerouting to G0. Right: Single-component histogram showing the distribution of the time after treatment when cells inactivate APC/C. Note that almost all cells that continued on to S phase after NCS treatment inactivated the APC/C within 2 hours of treatment.
