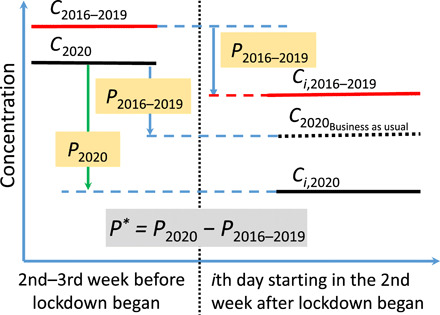
Fig. 1. Concept of detrending air pollutant levels.

C2016–2019 and C2020 are the average concentrations of an air pollutant in the second and third weeks before the lockdown start date or equivalent in 2016–2019 and 2020, respectively; Ci,2016–2019 and Ci,2020 are the daily average concentrations of an air pollutant in the ith day starting in the second week after the lockdown start date or equivalent in 2016–2019 and 2020, respectively. The vertical dashed line represents lockdown start date. P2016–2019 and P2020 are the percentage changes in air pollutant levels after versus before the lockdown began or equivalent in 2016–2019 and 2020, respectively (see Eq. 2 in the main text for definition). C2020Business as usual is the hypothetical concentration for the ith day starting in the second week after the lockdown date under “business-as-usual” (i.e., no lockdown) conditions. This is calculated from the prelockdown concentration (C2020) assuming the same percentage change as in 2016–2019 (P2016–2019, as the “business-as-usual” change). The detrended percentage change P* (i.e., the change in air pollutant concentration arising from lockdown effects alone) is given by P2020 − P2016–2019.
