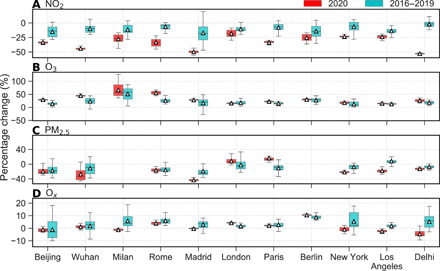
Fig. 3. Box plots of percentage change (Pdew) in deweathered concentrations of air pollutants in 2020 versus 2016–2019.

Rows represent (A) NO2, (B) O3, (C) PM2.5, and (D) Ox. Lower and upper box boundaries represent the 25th and 75th percentiles, respectively; line and triangle inside boxes represent median and mean values, respectively; lower and upper error lines represent 1.5 * IQR (interquartile range) below the third quartile and above the first quartile, respectively. Number of samples for Pdew in 2020 and 2016–2019 is usually 28 and 112, respectively.
