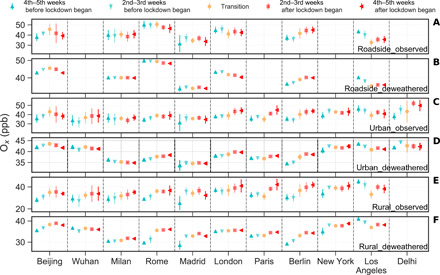
Fig. 4. Observed and deweathered Ox (i.e., NO2+ O3) mixing ratios in the 5 weeks before and after the lockdown start dates in the studied cities in 2020.

The six rows (from top to bottom) show results from roadside observed (A) and deweathered (B), urban background observed (C) and deweathered (D), and rural observed (E) and deweathered (F) mixing ratios. Deweathered Ox shows little change before and after the lockdown dates in 2020 and is similar across all urban background sites (all close to 40 ppb). Error bars (included for all points) represent 1 SD (n = 14). Transition period refers to the 2 weeks with the lockdown start date in the middle.
