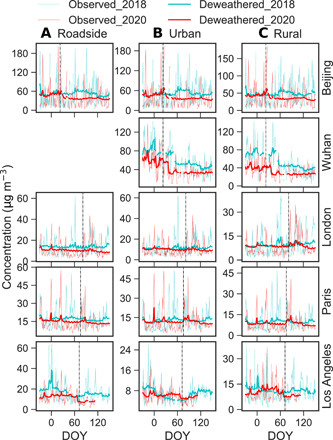
Fig. 5. Observed and deweathered daily PM2.5 concentrations in the selected cities before and after the lockdown start dates or equivalent in 2020 versus 2018.

Columns correspond to (A) roadside, (B) urban background, and (C) rural sites; rows show different cities as indicated. Fine and heavy lines indicate observed and deweathered concentrations, respectively. Data are shown from December to May, shown as day of year (1 January = 1), where the vertical dashed lines represent lockdown start date. Results from other cities/sites are shown in fig. S2. No data are available for roadside sites in Wuhan.
