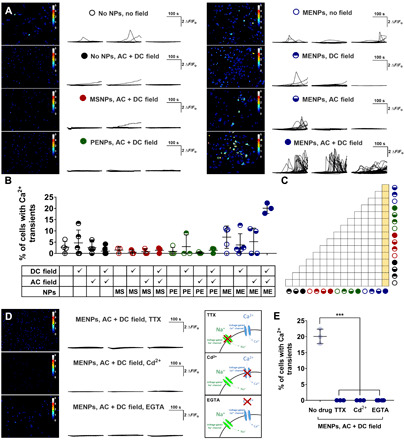
Fig. 2. Magnetic stimulation of MENPs modulates neuronal cell activity in vitro.

Cells were treated with MENPs, using no NPs, MSNPs, or PENPs as controls, before magnetic stimulation. Magnetic stimulation was 220 mT DC (DC), 6 mT and 140 Hz AC (AC), or both DC and AC fields along the same axis (AC + DC). Neuronal activity was measured in real time via intracellular Ca2+ imaging using Fluo4 dye, and cell fluorescence was traced over time per cell. Images of total Ca2+ activity over time is shown for selected experimental groups. Calibration bars represent ΔF/Fo (A). The percent of cells demonstrating intracellular Ca2+ transients in (A) is summarized in (B), and significantly different group comparisons are marked in yellow within (C). Cells were treated with TTX, Cd2+, or EGTA before treatment with MENPs and AC and DC magnetic stimulation, and total Ca2+ activity over time is shown next to a diagram depicting the inhibiting activity of each drug (D). Measured Ca2+ transients of drug-treated cells are summarized with no drug, MENP, and AC + DC field–treated cells shown as faded plot points for comparison (E). Plots show traces of Ca2+ activity over time in individual cells (A and D) and individual points with bars showing means ± SD (B and E) (n = 3 to 6); ANOVA with Tukey’s posttest (C) or Dunnett’s posttest with no drug as the control (E); ***P < 0.001, unlabeled group comparisons are not significantly different.
