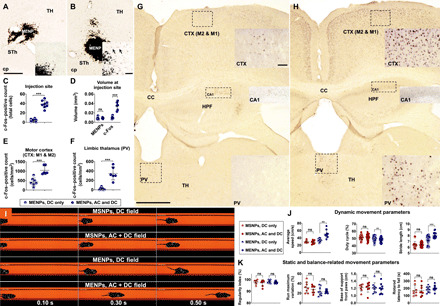
Fig. 3. Magnetic stimulation of MENPs locally modulates neural activity in mice, yielding modulation of basal ganglia circuitry and behavioral change.

Staining for c-Fos protein locally to the MENP injection site following DC magnetic stimulation (A) or AC and DC magnetic stimulation (B) shows increased c-Fos expression (C) and increased c-Fos–positive tissue volume (D) in the latter. Quantification of c-Fos expression in the motor cortex (E) and limbic thalamus (F) shows increased expression when MENPs were stimulated with an AC and DC magnetic field (H) versus only a DC magnetic field (G). TH, Thalamus; cp, Cerebral Peduncle; STh, Subthalamic nucleus, HPF; Hippocampal formation; cc, corpus callosum; PV, paraventricular nucleus. Time-lapse images showing mouse movement in a CatWalk video recording system (I). Dynamic movement parameters as measured by the CatWalk recording showed significant changes in mouse speed, limb duty cycle, and limb stride length (J) in MENP-treated mice following AC and DC stimulation versus DC stimulation, while MSNP-treated mice showed no significant change. Static movement parameters of mouse movement such as regularity index, run maximum variation, and front-paw base of support as measured by CatWalk recording did not significantly change with AC and DC versus DC only magnetic stimulation in either nanoparticle group (K). Rotarod latency to fall also did not significantly change with AC and DC versus DC only magnetic stimulation in either nanoparticle group (K). Scale bar, 250 (overview) and 50 μm (inset) (A, B, G, and H). Plots show individual points with bars showing means ± SD (C to F, J, and K) [n = 8 mice (C); n = 6 to 7 mice (D to F); n = 8 to 9 mice (J and K), individual limb values for duty cycle and stride length]; unpaired t test (C to F) or paired t test (J and K), **P < 0.01 and ***P < 0.001. ns, not significant.
