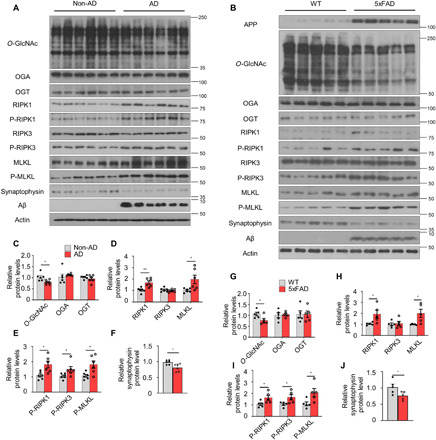
Fig. 1. Association of O-GlcNAcylation and necroptosis in AD.

(A and B) Western blot analysis of brain tissues of patients with AD and nondemented controls (non-AD) (n = 6) (A) and 5xFAD and WT mice (n = 5; 12 months of age) (B). (C to J) Quantification of O-GlcNAcylation–related proteins (C and G), necroptosis-related proteins (D and H), phosphorylated necroptosis–related proteins (E and I), and synaptophysin (F and J) in (A) and (B). The levels of phosphorylated necroptosis–related proteins were normalized to the levels of the corresponding total proteins. Values are presented as means ± SEM. *P < 0.05 and **P < 0.01 versus non-AD (C to F) or WT (G to J); two-tailed Student’s t test.
