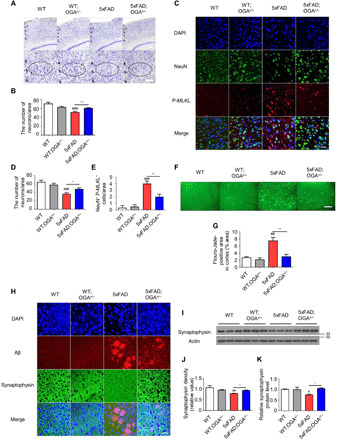
Fig. 3. Increased O-GlcNAcylation reduced neuronal loss in the brain tissue of 5xFAD.

(A) Nissl staining in the cortical region of indicated mouse genotypes (n = 3 to 5). Scale bars, 100 μm. (B) The number of neurons in the cortical region of mice in (A). (C) Immunostaining of NeuN and P-MLKL in the cortical region of mice samples (n = 3 to 4). Scale bar, 20 μm. (D and E) The number of NeuN-positive cells (D) and NeuN/P-MLKL double-positive cells (E) in (C). (F) Flouro-Jade C staining in the cortical region of mice samples (n = 3). Scale bar, 100 μm. (G) Quantification of Flouro-Jade C–positive area in (F). (H) Immunostaining of Aβ and synaptophysin in the cortical region of mice samples (n = 3 to 4). Scale bar, 20 μm. (I) Synaptophysin protein level in the cortical region of mice samples (n = 3). (J) Quantification of synaptophysin density in (H). (K) Quantification of synaptophysin proteins levels in (I). Three to five slices of each sample were used to normalize each sample. Values are presented as means ± SEM. #P < 0.05, ##P < 0.01, and ###P < 0.001 versus WT; *P < 0.05 and **P < 0.01 versus 5xFAD; one-way ANOVA with Tukey’s test.
