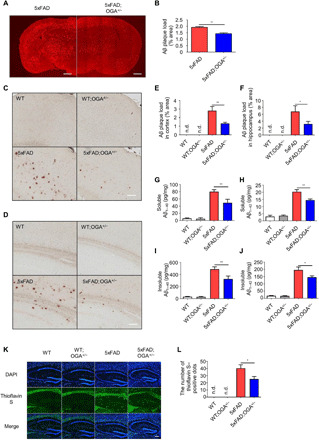
Fig. 5. Increased levels of O-GlcNAc reduce Aβ accumulation.

(A) Immunostaining of Aβ plaques in the brain of 5xFAD and 5xFAD;OGA+/− mice (n = 4). Scale bars, 1 mm. (B) Quantification of Aβ plaque loads in (A). (C and D) Images of Aβ immunoreactivity with DAB staining in the cortex (C) and hippocampus (D) tissue of mice samples (n = 3 to 5). Scale bars, 100 μm. (E and F) Quantification of Aβ immunoreactivity detected with DAB staining in the cortex (E) and hippocampus (F) tissue of mice samples. (G to J) The levels of soluble (G and H) and insoluble (I and J) Aβ40 and Aβ42 measured by ELISA in mouse cerebral cortex samples (n = 4 to 6). (K) Staining of Aβ plaques with thioflavin S in the hippocampus of mice samples (n = 3 to 5). Scale bar, 150 μm. (L) The number of thioflavin S–positive dots in (K). Three slices of each sample were used to normalize each sample. Values are presented as means ± SEM. *P < 0.05 and **P < 0.01 versus 5xFAD; one-way ANOVA with Tukey’s test (G to J) and two-tailed Student’s t test (B, E, F, and L). n.d., not detectable.
