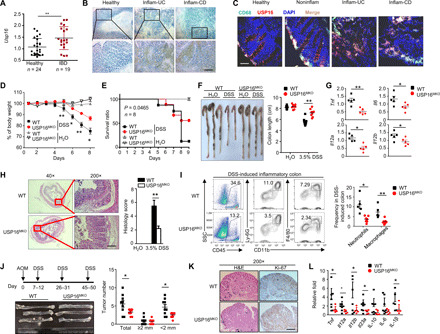
Fig. 6. USP16 deficiency in macrophages alleviates experimental colitis and inflammation-mediated colon carcinogenesis.

(A) CD11b- and CD68-positive colon macrophages were isolated from patients with UC or CD or from healthy donors. qRT-PCR was performed to analyze the USP16 mRNA levels. (B) Immunohistochemical examination of USP16 protein in inflammatory tissue samples of patients with IBD and in healthy samples. Scale bar, 50 μm. (C) Immunofluorescence images of USP16 and CD68 staining in human colon tissue sections. Scale bar, 50 μm. WT and USP16MKO mice were treated with 3% [(D) and (F) to (I)] or 3.5% (E) DSS (in drinking water) for five continuous days and then supplied with normal drinking water. (D and E) Body weight loss (D) and survival rates (E) of DSS-treated WT and USP16MKO mice. (F to H) Colon length (F), proinflammatory cytokine production (G), and hematoxylin and eosin (H&E) histological staining (H) results for day 8 DSS-treated WT and USP16MKO mice (scale bar, 100 mm). (I) FACS analysis results for the total immune cells (CD45+), macrophages (CD11b+F4/80+), and neutrophils (CD11b+Ly6G+), presented in a representative plot for multiple mice (n = 4). (J) Schematic of mouse treatment with AOM/DSS. The colons of WT and USP16MKO mice were photographed. The numbers of tumors of different sizes were measured. (K) Representative images of Ki-67 staining of colon tumors of WT and USP16MKO mice (scale bar, 50 μM). (L) qRT-PCR assay of cytokine levels in colon tissue of AOM/DSS-treated WT and USP16MKO mice. All qRT-PCR data are presented as the fold induction relative to the Actb mRNA level. Photo credits of (B), (C), (F), (H), (J), and (K): Yu Zhang (Zhejiang University). The data are presented as the means ± SEMs and are representative of at least three independent experiments. The statistical analysis results show the variations among experimental replicates. Two-tailed unpaired t tests were performed. *P < 0.05 and **P < 0.01.
