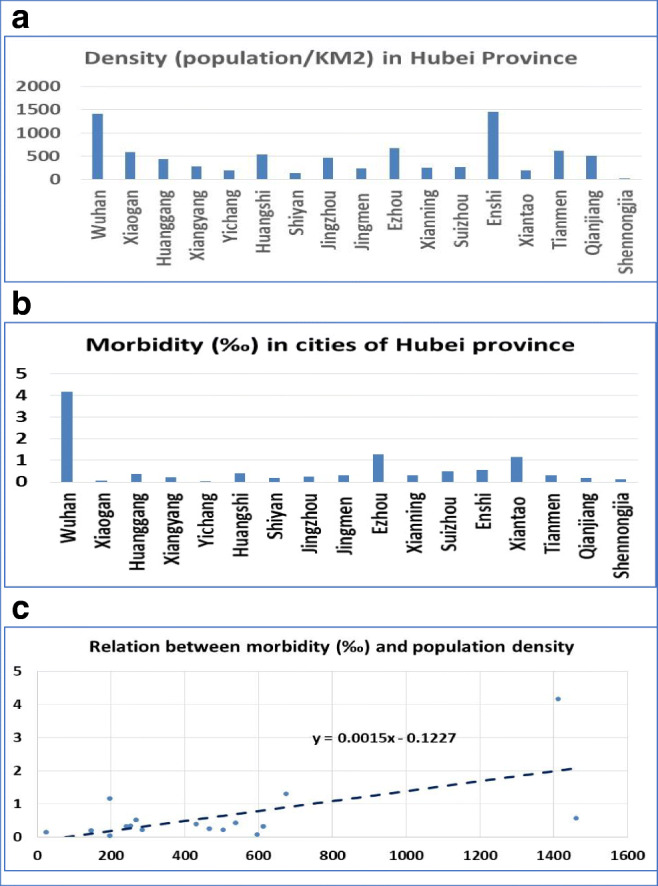
Fig. 1.

Population density and morbidity in Hubei province. a Population density in the 17 cities in Hubei province. The number on the vertical axis is the average number of persons per kilometer. Names of the cities are listed on the horizontal axis. b Disease morbidity rate in the 17 cities in Hubei province. The number on vertical axis is the average rate of morbidity. Names of the cities are listed on the horizontal axis. c The relationship between the population density and disease morbidity analyzed by simple linear regression. The number on vertical axis is the disease morbidity rate, and the horizontal axis is the number of persons per kilometer
