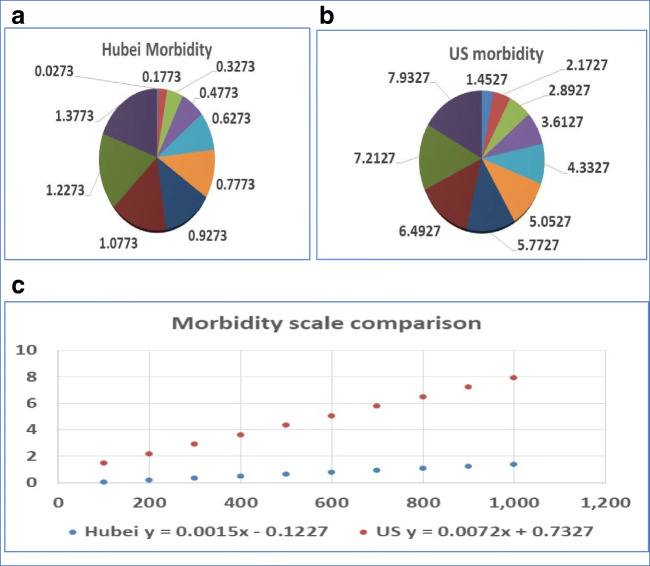
Fig. 4.
Comparison of the morbidity scales between major cities in the Hubei province of China and the US states and territories. a The morbidities at ten different scales were calculated based on the formula derived from 17 cities of the Hubei province in China. b The morbidities at ten different scales were calculated based on the formula derived from 53 major cities of the US states and territories. c The comparison of disease morbidities between cities in China and in the US states and territories when the population density increases from 100 to 1000 persons per kilometer. The number on the vertical axis is the disease morbidity rate, and the horizontal axis is the number of persons per kilometer

