Figure 2. SARS-CoV-2 enters faster on Calu-3 cells than SARS-CoV and entry speed is increased by the multibasic cleavage site.
(A) SARS-CoV PP and SARS-CoV-2 PP infectivity on VeroE6 and Calu-3 cells. (B and C) SARS-CoV PP and SARS-CoV-2 PP entry route on Calu-3 cells. Cells were pretreated with a concentration range of camostat (B) or E64D (C) to inhibit serine proteases and cathepsins, respectively. T-test was performed for statistical analysis at the highest concentration. *p<0.05. (D and E) SARS-CoV PP, SARS-CoV-2 PP (D) and authentic virus (E) entry speed on Calu-3 cells. T-test was performed for statistical analysis at the latest time point. *p<0.05. (F) Schematic overview of SARS-CoV S protein mutants. MBCS residues are indicated in red. The SARS-CoV-2 PRRA motif was inserted into SARS-CoV PPs (SARS-PRRA). (G) Comparison of S1 cleavage of SARS-CoV PP and the MBCS mutant. VSV-M silver stains are shown as a production control. (H and I) SARS-CoV PP, SARS-PRRA PP, and SARS-CoV-2 PP entry route on Calu-3 cells. Cells were pretreated with a concentration range of camostat (H) or E64D (I) to inhibit plasma membrane and endosomal entry, respectively. One-way ANOVA was performed for statistical analysis comparing all groups with SARS-CoV PPs at the highest concentration. *p<0.05. (J and K) Entry speed on Calu-3 cells of SARS-CoV PPs compared with SARS-PRRA PPs (J) and SARS-CoV-2 PPs compared with SARS-2-Del-PRRA PPs (K). T-test was performed for statistical analysis at the latest time point. *p<0.05. Experiments were performed in triplicate (A–E, H–K). Representative experiments from at least two independent experiments are shown. Error bars indicate SD. ANOVA, analysis of variance; MBCS, multibasic cleavage site; PP, pseudoparticles.

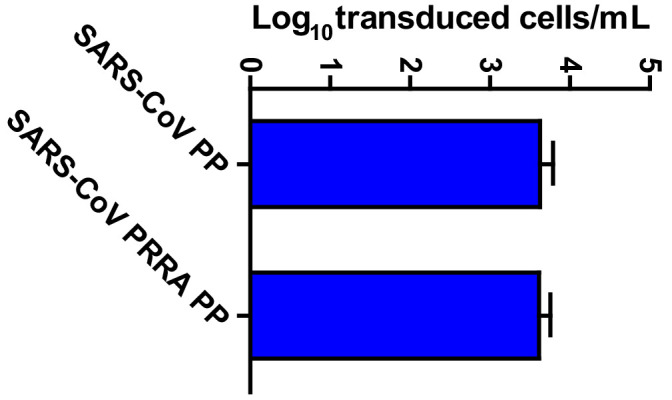
Figure 2—figure supplement 1. SARS-CoV PP infectivity into Calu-3 cells is not altered by the insertion of the multibasic cleavage site.