. 2021 Jan 13;10:e61912. doi: 10.7554/eLife.61912

Figure 1. TSLP acts directly on CD8+ T cells during primary influenza infection.

(A) TSLPR expression on influenza-specific CD8+ T cells (P14 tg) during primary influenza infection. Top panel, experimental design. Bottom panel, flow cytometric analysis. Naïve cells were gated on CD44lo cells. (B–F) (B) Top panel, experimental design for C-H, where 2.5 × 10⁴ of WT (Thy1.1+/1.1+) and Crlf2-/- (Thy1.1+/1.2+) P14 T cells were co-transferred into naïve WT C57BL/6 mice (Thy1.2+/1.2+), except in one experiment the markers were reversed, with the WT cells Thy1.1+/1.2+ and the Crlf2-/- P14 T cells were Thy1.1+/Thy1.1+ (see also Figure 1—figure supplement 1 and G). Bottom panel, Similar numbers of WT P14 cells and Crlf2-/- P14 cells were present. On the following day, the mice were infected intranasally (i.n.) with 103 EID50 of PR8-33. Mice were analyzed at Day 8 p.i. (C–F) or at a memory time point (>day 30 p.i.) (G and H). (C) TSLPR expression on influenza-specific P14 CD8+ T cells in the tissues on day 8 p.i. (D) Proportion of WT and Crlf2-/- T cells at day 8 p.i. in the tissues (shown are combined data from three independent experiments). (E and F) The expression of CD127 on WT and Crlf2-/- P14 cells in lungs and spleen. Shown are a representative flow cytometry plot (E) and summary of MFI data for CD127 expression (F). (n = 10). Data are mean ± SEM. (G and H) The proportion of WT and Crlf2-/- P14 cells of transferred cells in BAL, lungs, LN, and spleen at a memory time point, shown as a representative flow cytometry plot (G) and combined data from three independent experiments (H). ns = not significant; *p<0.05; ***p<0.005, using a two-tailed paired students t-test. Data shown are representative of at least two independent experiments.

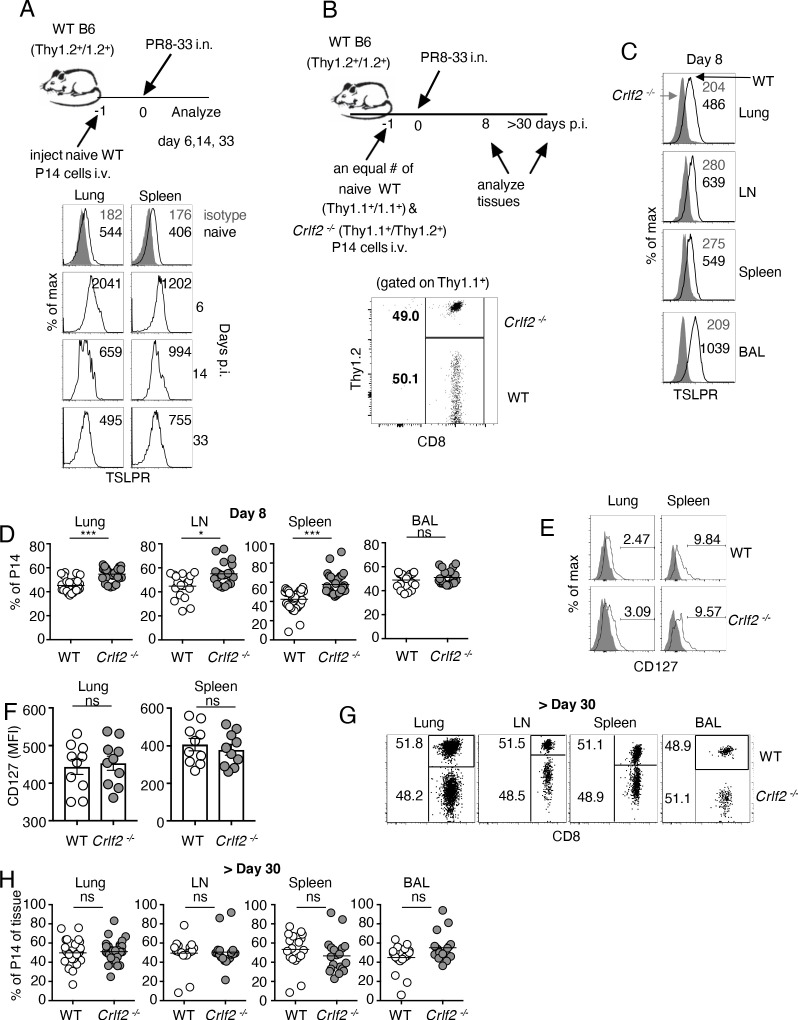
Figure 1.

Figure 1—figure supplement 1. Thy1.1/Thy1.1 versus Thy1.1/Thy1.2 genetic background differences do not explain the different number of WT versus Crlf2-/- P14 T cells after influenza infection.

Figure 1—figure supplement 1.

2.5 × 10⁴ WT and Crlf2-/- P14 T cells were co-transferred into naive WT C57BL/6 mice (Thy1.2+/1.2+), and on the following day the mice were infected intranasally (i.n.) with PR8-33. In (A), the WT P14 T cells were Thy1.1+/1.1+ and the Crlf2-/- cells were Thy1.1+/1.2+. In (B), the WT P14 T cells were Thy1.1+/1.2+ and the Crlf2-/- cells were Thy1.1+/1.1+. The proportion of WT and Crlf2-/- T cells at day 8 p.i. in the tissues are shown. Data are mean ± SEM. ns = not significant; *p<0.05; ***p<0.001; ****p<0.0001 using a two-tailed paired students t-test.
Figure 1—figure supplement 2. TSLP does not affect the transition to effector cells, cytokine secretion, or granzyme B levels during primary infection.

Figure 1—figure supplement 2.

2.5 × 10⁴ of WT (Thy1.1+/1.1+) and Crlf2-/- (Thy1.1+/1.2+) P14 T cells were co-transferred into naïve WT C57BL/6 mice (Thy1.2+/1.2+) and on the following day the mice were infected intranasally (i.n.) with 103 EID50 of PR8-33. (A–C). Lung mononuclear cells and splenocytes were isolated at day 8 p.i. CD44 (A), KLRG1 (B), and Granzyme B (C) levels were then assessed by mean florescent intensity (MFI) by flow cytometry (gating on live Thy1.1+ CD8+ T cells and then either WT (Thy1.2-) or Crlf2-/- (Thy1.2+)). (n = 10). Data are mean ± SEM. (D) Cells were re-stimulated with gp33 peptide in the presence of monensin and brefeldin A for 5 hr and production of IFN-γ and TNF-α was assessed by flow cytometry. In (D), shown are the percentage of cells expressing IFN-γ, TNF-α, or both IFN-γ and TNF-α. (n = 10). Data are mean ± SEM. ns = not significant; *p<0.05; **p<0.01 using a two-tailed paired students t-test. Data shown are representative of at least two independent experiments.