. 2020 Dec 14;9:e62614. doi: 10.7554/eLife.62614

Figure 2. Structure of DolP.

(A) Solution structure and topology of DolP, with α helices, β strands and termini labelled. (B) Backbone model of the 20 lowest-energy solution structures of DolP. The core folded domain is highlighted in red whilst the flexible N-terminal is shown in grey. The dynamic nature of the linker was demonstrated from S2 order parameter analysis calculated from chemical shift assignments using TALOS+. (C) Small-angle X-ray scattering curve of DolP with corresponding best fit of the solution structure of DolP. Best fit calculated based on the core DolP solution structure with flexibility accommodated in residues 20–46, 112–118, and 189–195. The corresponding ab-initio bead model is shown calculated using Dammif (Franke and Svergun, 2009) based solely on the scattering data. (D) Western blots of total protein extracts show plasmid-mediated expression of DolP in E. coli ΔdolP after site-directed mutation of conserved residues. The empty vector (EV) control is labelled and WT represents wild-type DolP. The presence of the OM lipoprotein BamB was used as a control. Colony growth assays by serial dilution of mutants on 4.8% SDS reveal which residues are critical for the maintenance of the OM barrier function. (E) Structure of DolP showing position of transposon-mediated insertions. Western blots of total protein extracts show plasmid-mediated expression of mutant versions of DolP in E. coli ΔdolP. The empty vector (EV) control is labelled and WT represents wild-type DolP. Colony growth assays by serial dilution of mutants on 4.8% SDS reveal which insertions abolish DolP function. Blue labels represent position of non-functional insertions. Orange labels represent position of tolerated insertions. The presence of the OM lipoprotein BamB was used as a control.

Figure 2—source data 1. Influence of site directed mutagenesis of DolP of protein production and stability.
Figure 2—source data 2. S2 order parameter analysis.

Figure 2.

Figure 2—figure supplement 1. DolP is monomeric.

Figure 2—figure supplement 1.

(A) DolP, lacking the site of acylation, was purified and subject to analytical ultracentrifugation. DolP demonstrated a uniform sedimentation velocity consistent with a monomeric species. (B) Column chromatography of purified DolP revealed that it had an elution profile consistent with a single monomeric species.
Figure 2—figure supplement 2. Structural analysis of the DolP BON domains.

Figure 2—figure supplement 2.

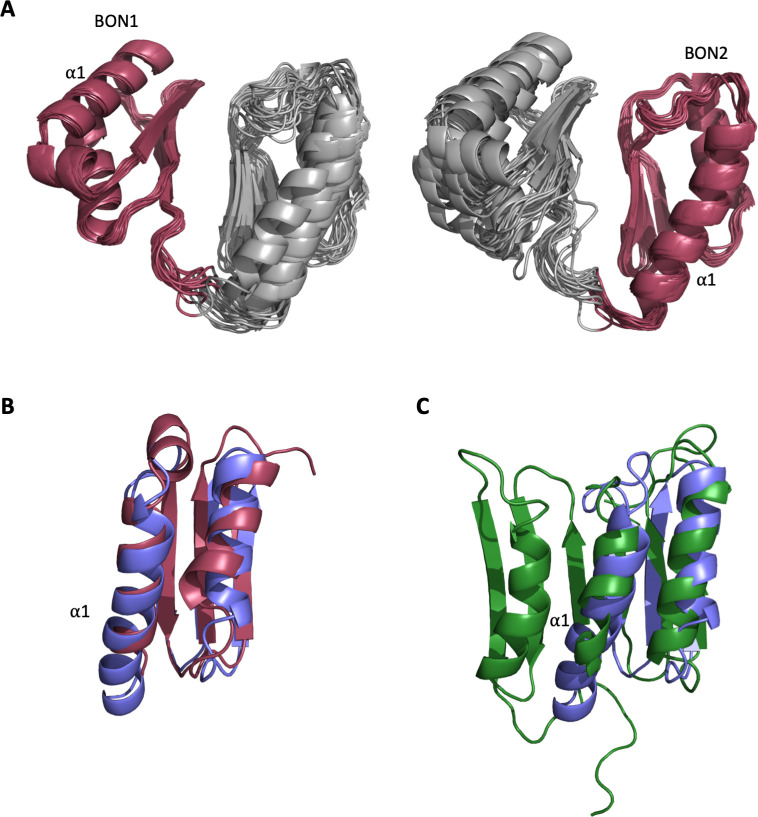
(A) The ensemble of the 20 lowest-energy structures superimposed to DolP BON1 (N47-I111) and BON2 (G120-T185) domain backbones showing how well the domains superimpose as well as the respective degrees of freedom available to each domain. (B) Dalilite superposition of DolP BON domains 1 (Red; residues 46–114) and 2 (Blue; residues 117–189). The BON domains are similar except for the double turn extension of the BON2:α1 helix and the presence of the α1’ helix present in BON1 that is absent in BON2. The pairwise RMSD for backbone heavy atoms is 1.8 Å and dalilite Z-score is 8.4. (C) Superposition of DolP BON2 (Blue) on to the BON subdomain of Rv0899 (OmpATb) (Green; accession code – 2KSM; residues 136–196). For BON2 the pairwise RMSD for backbone heavy atoms was 2.7 Å and the dalilite Z-score was 4.9. Similarly, for BON1 the pairwise RMSD was 2.6 Å and the dalilite Z-score was 5.3.
Figure 2—figure supplement 3. Alignment of DolP sequences from diverse proteobacterial species.

Figure 2—figure supplement 3.

(A) The amino acid sequences of the experimentally derived BON domains of DolP and OmpATb are aligned with the predicted amino acid sequences of the BON domains from Kbp and OsmY. The position of the experimentally derived secondary structure for DolP BON1 and BON2 and OmpATb are depicted below the sequence alignment. (B) Alignments of the amino acid sequences of DolP and OsmY from various Gram-negative bacteria. The positions of the experimentally-derived secondary structural elements of E. coli DolP are depicted below the sequence alignment. The signal sequence is depicted by the red box. The Lipobox associated with recognition by LspA and acylation is highlighted in purple. The conserved glycine residues are highlighted in blue and the tyrosine residue associated with interdomain interactions is highlighted in green. Residues showing CSPs are highlighted in pink.
Figure 2—figure supplement 4. Additional SAXS analysis of DolP.

Figure 2—figure supplement 4.

(A) Zoom in of the low s region of the small-angle X-ray scattering curve of DolP shown in Figure 2 highlighting the closeness of fit to the DolP solution structure. (B) Residuals plot between the DolP solution structure and the small-angle X-ray scattering curve highlighting the closeness of fit.
Figure 2—figure supplement 5. Representation of DolP interdomain interactions highlighting the location of interdomain NOEs identified.

Figure 2—figure supplement 5.

38 interdomain NOEs were identified via Cyana (Table 3). Due to the ambiguity between chemically equivalent hydrogens within the same group, multiple NOEs are displayed to all equivalent hydrogens resulting in 83 NOEs being displayed.
Figure 2—figure supplement 6. SAXS processing analysis.

Figure 2—figure supplement 6.

(A) The linear region of the Guinier plot measured from the raw SAXS data for DolP. Values for Rg and I(0) are shown calculated using AutoRG in program Primus. (B) Pair-wise distance distribution P(r), calculated from the scattering curve of DolP, calculated using gnom arbitrary units (a.u.).