. 2020 Dec 14;9:e62614. doi: 10.7554/eLife.62614

Figure 3. DolP BON2:α1 binds phospholipid.

(A) DolP ribbon structure highlighting residues exhibiting substantial CSPs (Δδave) upon DHPG micelle interaction. The histogram shows the normalised perturbations induced in each residue’s amide signal when DHPG (40 mM) was added to DolP (300 µM). Examples of significant CSPs are shown. (B) Histogram showing intensity reductions of HN signals of DolP induced by adding 5-doxyl PC and DMPG into DPC/CHAPs micelles and the corresponding structure of a representative DolP-micelle complex calculated using CSPs and doxyl restraints using the program HADDOCK. Only the BON2:α1 helix is observed making contact with the micelle surface. No corresponding interaction of the BON1:α1 helix is observed. Zoom panels show burial of BON2:α1 into the micelle. The side chains of DolP residues that intercalate between the acyl chains (G120, S123, W127, T130, and S134) are coloured red. The side chains of residues that buttress the interface (E121, N124, T126, I128, K131, R133, and Q135) are coloured yellow. DolP is shown in blue and the phospholipid micelle is shown in tan.

Figure 3—source data 1. Chemical shift perturbations for lipid titration results.
Figure 3—source data 2. Data for HADDOCK calculations of micelle-DolP interactions.

Figure 3.

Figure 3—figure supplement 1. dolP has genetic interactions with bamB and bamE but no detectable physical interaction.

Figure 3—figure supplement 1.

(A) dolP genetically interacts with the genes encoding the non-essential BAM complex accessory lipoproteins. Strains were arrayed on LB Lennox agar plates using a Biomatrix six replicator. Genetic interaction plates were incubated for 12 hr at 37°C and imaged. An example of a 384‐well plate is shown above the graph. Each plate contained a total of 384 colonies consisting of 96 wildtype, single, and double mutant clones. Fitness was measured by quantifying colony size and integral opacity, which represents colony density, using the image analysis software Iris (Kritikos et al., 2017). Bar plots show the averaged values 96 technical replicates. The error bars represent the 95% confidence interval. (B) Phase contrast microscopy of WT, ΔdolP, ΔbamB, ΔbamC, ΔbamE, ΔbamBΔdolP, ΔbamCΔdolP and ΔbamEΔdolP cells after growth to mid-exponential phase (OD600 ~0.4–0.8). Scale bars represent 2 μM. Phase light cells can be observed for the ΔbamBΔdolP and ΔbamEΔdolP cells.( C) DolP immunoprecipitation. Whole cell triton X-100 solubilised lysates of E. coli BW25113 pDolPpelB, pBamA-His, and ΔdolP, were purified by Ni-NTA affinity chromatography then detected by western blot using anti-DolP and BamA-E antibodies. (D) Purified OM samples from E. coli BW25113 parent (WT) or ΔdolP cells were separated by SDS-PAGE, with (d) and without (n) boiling before being visualised by staining with coomassie.
Figure 3—figure supplement 1—source data 1. Genetic interactions with DolP.
Figure 3—figure supplement 2. Loss of DolP affects membrane fluidity, but does not affect membrane lipid profiles.

Figure 3—figure supplement 2.

(A) SDS-PAGE gel showing separation of LPS preparations from E. coli BW25113 and E. coli BW25113 harbouring pET20b-wbbL which restores O-antigen expression on the bacterial cell surface. (B) Analysis of phospholipid profiles from purified ∆dolP cell envelopes. Phospholipids were extracted by the Bligh-Dyer method from E. coli IM or OM samples purified by sucrose density gradient centrifugation. Phospholipids were visualised by staining with phosphomolybdic acid and charring after being separated by thin-layer chromatography with the following mobile phase: Chloroform:methanol:acetic acid (65:25:10). Phospholipid profiles were also analysed by LC/MS-MS following separation on the Luna C8(2) column under a THF/MeOH/H2O gradient. Phospholipid compositions are shown as sum for each of the four major classes observed: lyso-phophatidylethanolamines (LysoPE), phosphatidylethanolamines (PE), phosphatidylglycerols (PG) and cardiolipins (CL). Each data set is from three biological replicates generated from three separately purified membranes. Error bars represent ±S.D. (C) PagP-mediated Lipid A palmitoylation assay. PagP transfers an acyl chain from surface exposed phospholipid to hexa-acylated Lipid A to form hepta-acylated Lipid A. [32P]-labelled Lipid A was purified from cells grown to mid-exponential phase in LB broth with aeration. An equal amount of radioactive material (cpm/lane) was loaded on each spot and separated by thin-layer chromatography before quantification. As a positive control, cells were exposed to 25 mM EDTA for 10 min prior to Lipid A extraction in order to chelate Mg2+ ions and destabilise the LPS layer, leading to high levels of Lipid A palmitoylation. Hepta-acylated and hexa-acylated lipid A was quantified and hepta-acylated Lipid A represented as a percentage of total. Triplicate experiments were utilised to calculate averages and standard deviations with students t-tests used to assess significance. Student’s t-tests: NS* p>0.1 compared with Parent EV. (D) E. coli BW25113 cells were grown overnight in LB (~16 hr) before being harvested by centrifugation and washed three times in PBS. Membrane fluidity was measured for each strain in triplicate and error bars represent standard deviation. Membrane fluidity is expressed as relative to E. coli BW25113 parent cells (WT).
Figure 3—figure supplement 2—source data 1. LPS production in a dolP negative background.
Figure 3—figure supplement 2—source data 2. Phospholipid content of membranes isolated from a dolP mutant.
Figure 3—figure supplement 2—source data 3. Comparison of hepta- and hexa-acylated LPS levels.
Figure 3—figure supplement 2—source data 4. Raw data for membrane fluidity assay.
Figure 3—figure supplement 3. DolP phosphatidylglycerol binding HSQC spectra.

Figure 3—figure supplement 3.

(A) 1H,15N HSQC spectra of 15N-DolP (300 μM) in the presence (red) and absence (black) of 40 mM 1,2-dihexanoyl-sn-glycero-3-phospho-(1'-rac-glycerol) (DHPG) highlighting the large chemical shift perturbations observed on DHPG binding. (B) Histograms showing the normalised CSP values observed in 15N-labelled DolP (300 μM) amide signals in the presence of 5 mM cardiolipin, 20 mM 1,2,-dihexanoyl-sn-glycero-3-phosphethanolamine and 20 and 40 mM 1,2-dihexanoyl-sn-glycero-3-phospho-(1'-rac-glycerol).
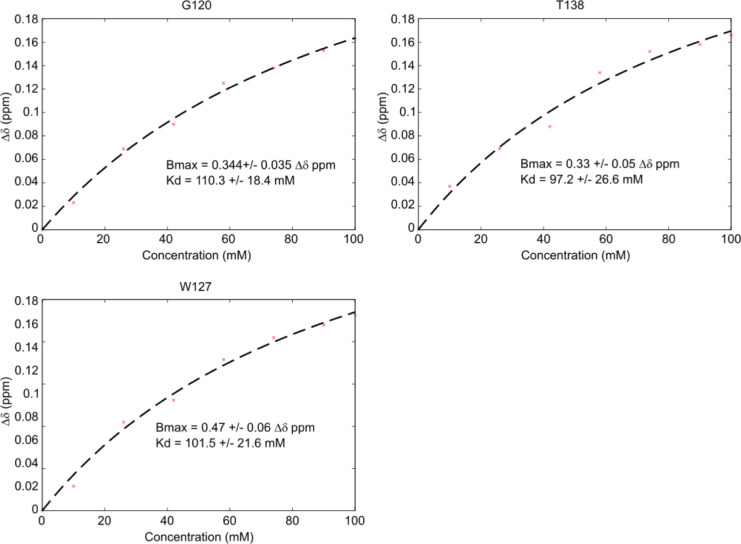
Figure 3—figure supplement 4. Kd estimation from HSQC titration data.

Figure 3—figure supplement 4.

Kd estimation was performed using the sum of the average chemical shift distance plotted against ligand concentration and fit using a standard ligand binding curve. Representative fits for G120, W127, and T138 are shown with corresponding estimations for Bmax, the maximum Δδppm, and Kd highlighted.