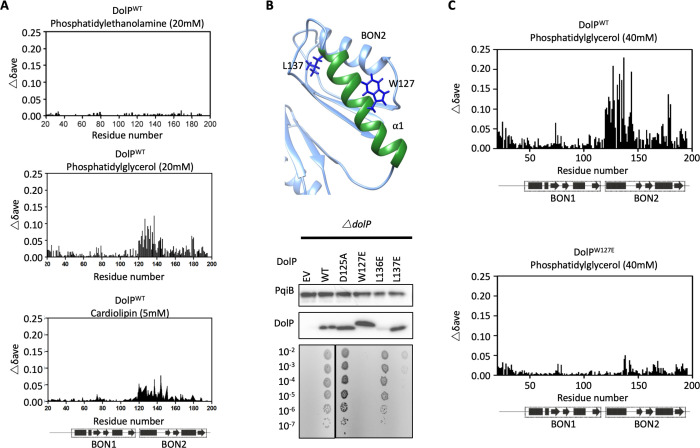
Figure 4. DolP specifically recognises anionic phospholipid via BON2:α1.
(A) Histograms showing the normalised CSP values observed in 15N-labelled DolP (300 μM) amide signals in the presence of 20 mM 1,2,-dihexanoyl-sn-glycero-3-phosphethanolamine, 20 mM 1,2-dihexanoyl-sn-glycero-3-phospho-(1'-rac-glycerol) and 5 mM cardiolipin.( B) Mutagenesis of the BON2:α1 helix residues identified by CSPs. The positions of W127 and L137 are indicated as sticks. Western blots of total protein extracts show plasmid-mediated expression of DolP in E. coli ΔdolP after site-directed mutation of amino acid residues. The empty vector (EV) control is labelled and WT represents wild-type DolP. Colony growth assays of E. coli ΔdolP complemented with DolP mutants reveal which residues are critical for the maintenance of OM barrier function. The presence of the protein PqiB was used as a control. (C) Histograms showing the normalised CSP values observed in 15N-labelled DolPWT or DolPW127E mutant (300 μM) amide signals in the presence of 40 mM 1,2-dihexanoyl-sn-glycero-3-phospho-(1'-rac-glycerol).


