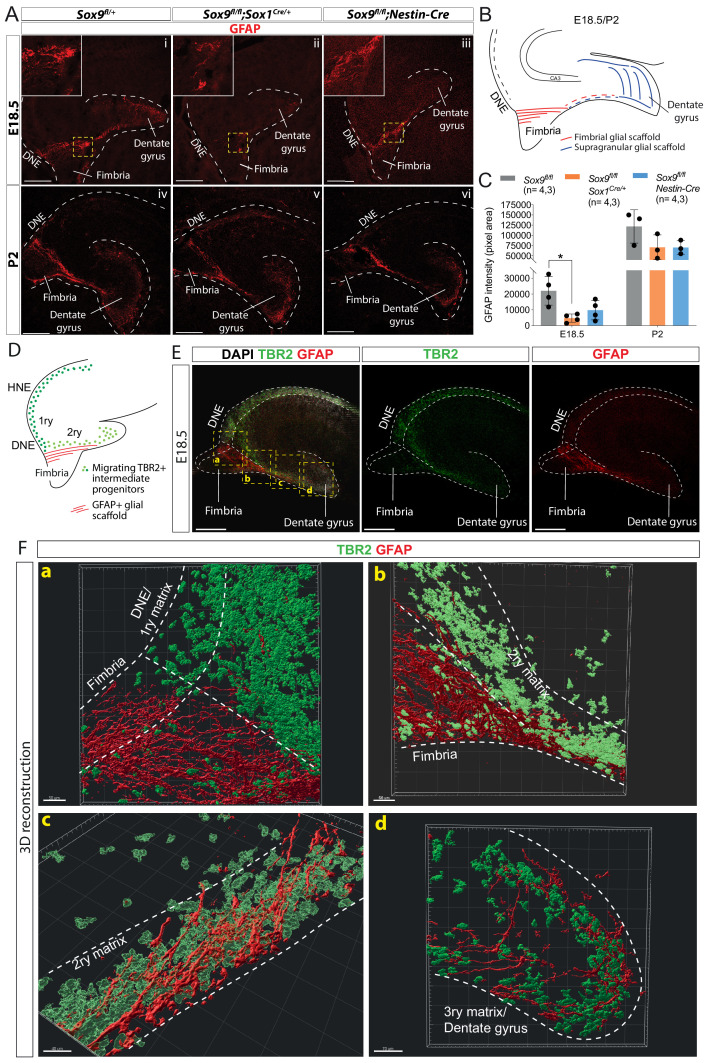
Figure 4. Delay in formation of the glial scaffold in Sox9 mutants may explain progenitor migration defects.
(A–C) Analysis of glial scaffold formation. (A) Immunofluorescence for GFAP on E18.5 (Ai-iii) and P2 (Aiv-vi) control, Sox9fl/fl;Sox1Cre/+ and Sox9fl/fl;Nestin-Cre brains showing GFAP reduction in both mutants at E18.5. Dashed line delineates the developing dentate gyrus (DG) area, yellow dashed squares indicate areas magnified in insets. (B) Representation of the glial scaffold (red lines) in DG. (C) GFAP immunofluorescence quantification (pixel area). At E18.5, GFAP expression was significantly reduced in Sox9fl/fl;Sox1Cre mutants (4745.17 ± 2609.79) compared to controls (22069.97 ± 9082.47, p=0.01120), while not in Sox9fl/fl;Nestin-Cre mutants (9803.93 ± 6141.10, Tukey’s multiple comparison test p=0.06090, ANOVA p=0.0121). At P2, GFAP expression is recovered in both Sox9 mutants compared to controls. (D–F) 3D reconstruction of control E18.5 embryos double immunostained for TBR2 and GFAP, (E) Representative control 10x single-plane confocal images of sections processed for 3D reconstruction (schematized in D; yellow dashed squares indicate processed regions shown in F). (F) Snapshots from 3D reconstruction show that the fimbrial scaffold and 1ry matrix progenitors are initially separated (a). 2ry matrix migrating progenitors then start to intermingle with GFAP+ fibers as the scaffold elongates from the fimbria (b,c). 3ry matrix progenitors are also distributed within the supragranular scaffold within the developing DG (d). Movies of all 3D reconstructions are available in the supplementary material (Videos 1–4). DNE: dentate neuroepithelium. Scale bars represent 200 µm.


