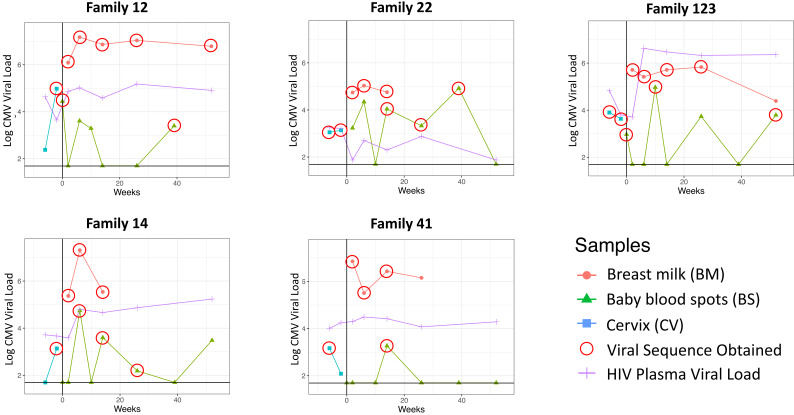
Figure 1. Cytomegalovirus (CMV) viral loads of longitudinal samples for each family from breast milk (red), baby blood spots (green), and cervix (blue), and HIV viral loads from mother’s blood plasma.
Vertical line indicates date of delivery. Horizontal line indicates minimum threshold of detection. Red circles indicate the samples that were submitted for whole-genome sequencing.


