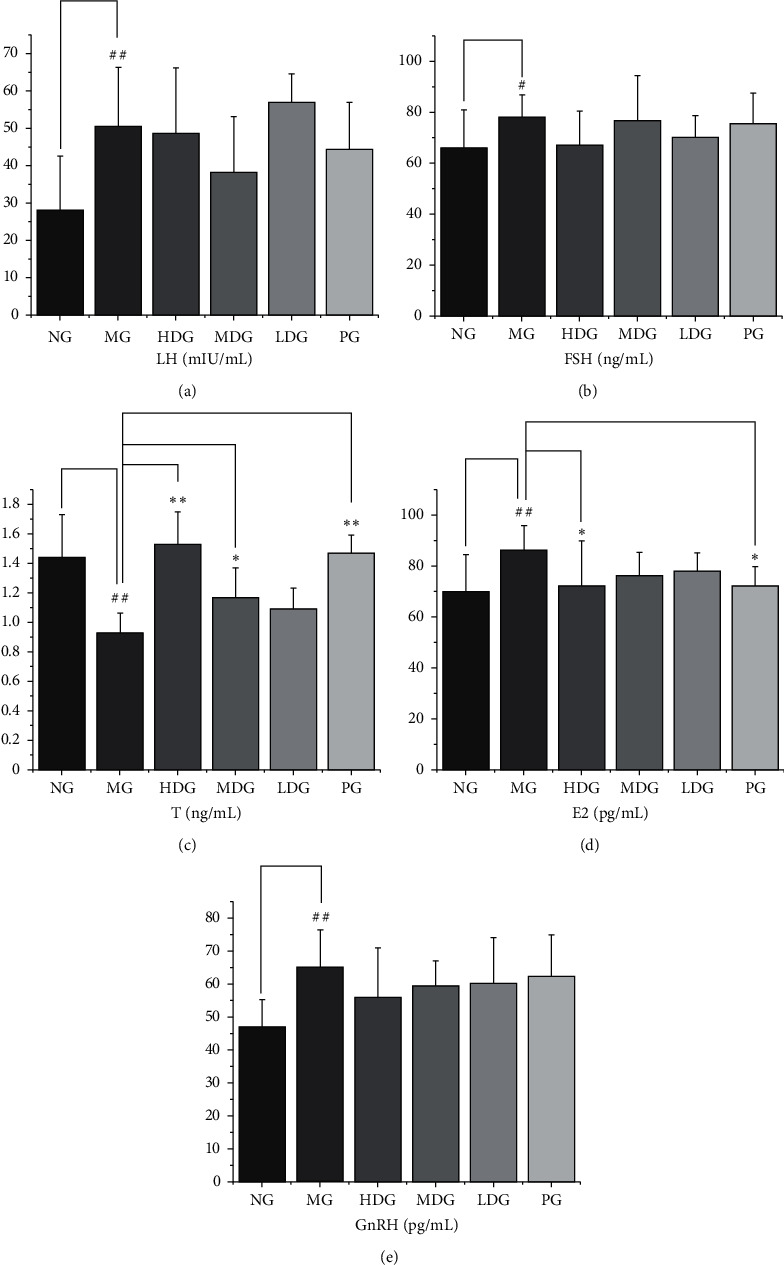
Figure 7.

The levels of LH, FSH, T, E2, and GnRH in serum. (a) LH, df = 56, F = 4.716. Compared with the normal group, the serum LH level of the model group was higher. (b) FSH, df = 59, F = 1.597. Compared with the normal group, the level of FSH in the serum of the model group was higher. Compared with the model group, there was no significant difference in serum FSH level of the other administration groups. (c) T, df = 55, F = 14.23. Compared with the normal group, the level of T of the model group was lower. Compared with the model group, the level of T of the high dose group, the middle dose group, and the positive group was higher. (d) E2, df = 54, F = 2.395. Compared with the normal group, the serum E2 content of the model group was higher. Compared with the model group, the serum E2 content of the high dose group and positive group was lower. (e) GnRH, df = 51, F = 2.848. Compared with the normal group, the level of GnRH of the model group was higher. ELISA was performed according to the manufacturer's protocol. The data of each group were expressed as mean ± standard deviation (SD). ##P < 0.01 and #P < 0.05 versus normal group; ∗∗P < 0.01 and ∗P < 0.05 versus model group. NG: normal group, MG: model group, HDG: high dose group, MDG: middle dose group, LDG: low dose group, PG: positive group.
