
Figure 1.
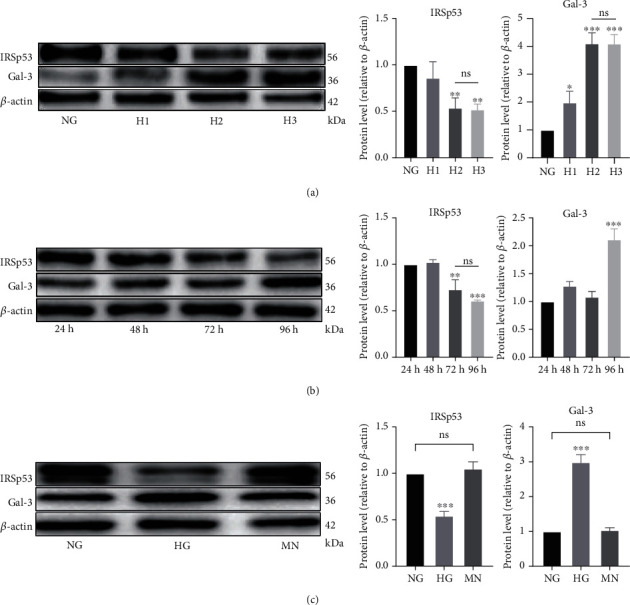
A high D-glucose concentration affected the expression levels of IRSp53 and gal-3 in HUVECs. (a) The expression levels of IRSp53 and gal-3 in HUVECs treated with D-glucose at different concentration for 96 h were determined by Western blotting using β-actin as a loading control. NG: normal glucose (25 mM); H1: high glucose 1 (40 mM); H2: high glucose 2 (60 mM); H3: high glucose 3 (80 mM). (b) The expression levels of IRSp53 and gal-3 in HUVECs treated with 60 mM D-glucose for different times were determined by Western blotting using β-actin as a loading control. (c) The expression levels of IRSp53 and gal-3 in HUVECs treated with 60 mM D-glucose or 60 mM mannitol for 96 h were determined by Western blotting using β-actin as a loading control. NG: normal glucose (25 mM); HG: high glucose (60 mM); MN: mannitol (60 mM). The values are the mean ± SD of three independent experiments. ∗P < 0.05 vs. the NG group; ∗∗P < 0.01 vs. the NG group; ∗∗∗P < 0.001 vs. the NG group.