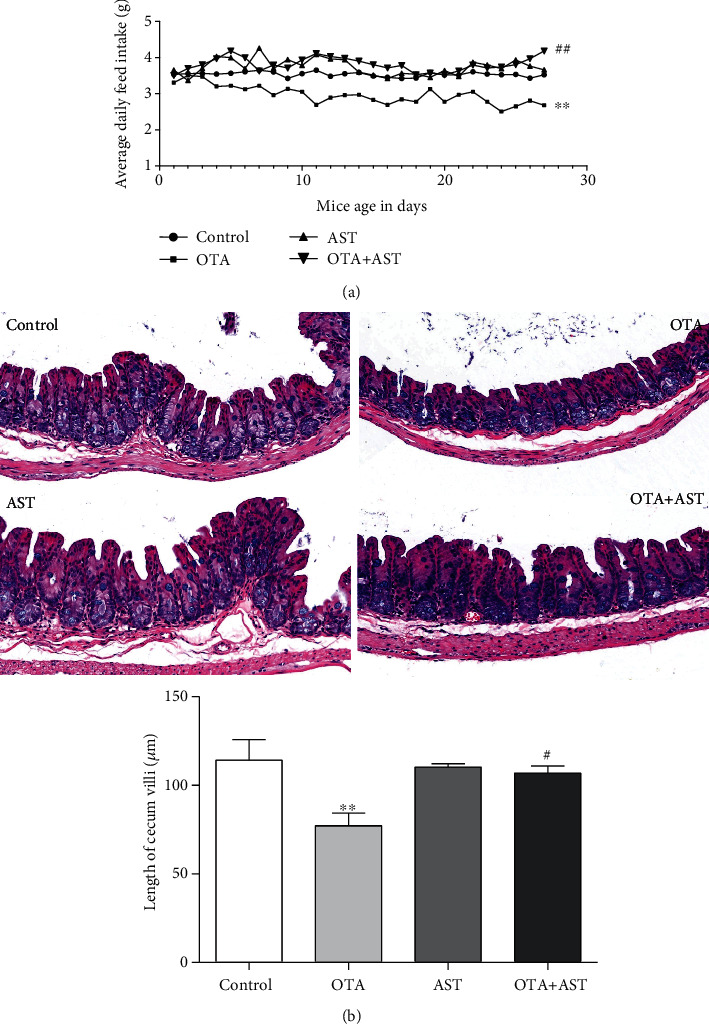
Figure 1.

Effects of OTA and AST on the daily feed intake in mice and length of mouse cecum villi. (a) The daily feed intake in mice n = 20 mice/group; (b) the length of mouse cecum villi n = 5 mice/group (200x), n = 5 mice/group. The control, OTA, AST, and OTA+AST represent the control group, OTA group, AST group, and AST intervention group, respectively. In comparison with the control group, ∗∗P < 0.01 and OTA group; #P < 0.05, ##P < 0.01 were considered to be statistically significant.
