
Figure 5.
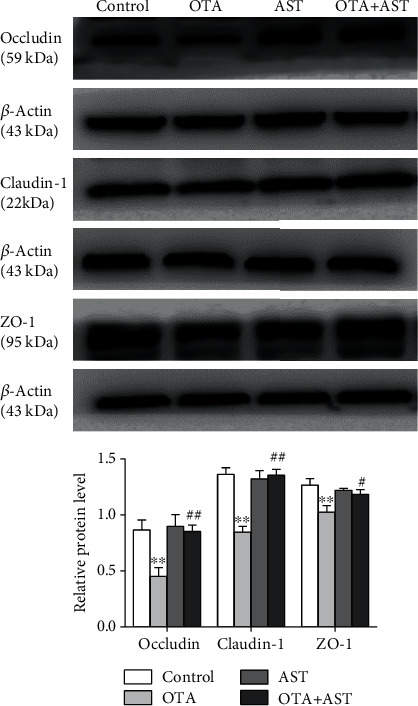
Effect of OTA and AST on the relative contents of occludin, claudin-1, and ZO-1 proteins in TJ proteins in mouse cecum. n = 5 mice/group. The control, OTA, AST, and OTA+AST represent the control group, OTA group, AST group, and AST intervention group, respectively. In comparison with the control group, ∗∗P < 0.01 and OTA group; #P < 0.05, ##P < 0.01 were considered to be statistically significant.