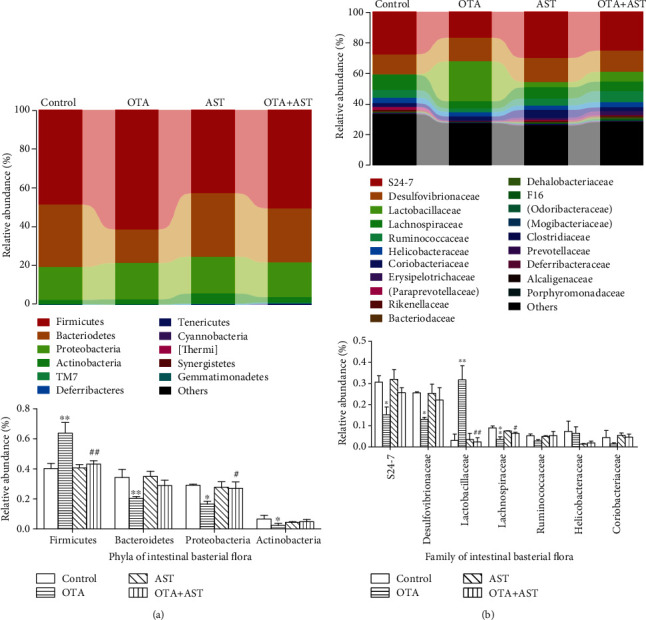
Figure 7.

Effects of OTA and AST on the diversity of cecum flora in mice. (a, b) The effects of compositions at the gate and section level, respectively. The control, OTA, AST, and OTA+AST represent the control group, OTA group, AST group, and AST intervention group, respectively. n = 5 mice/group. In comparison with the control group, ∗P < 0.05 and ∗∗P < 0.01 and OTA group; #P < 0.05, ##P < 0.01 were considered to be statistically significant.
