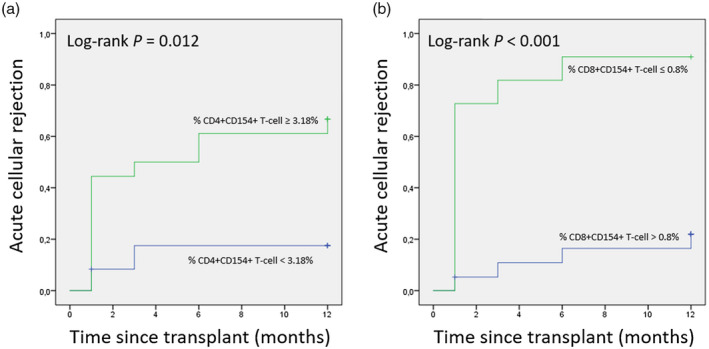
Fig. 5.

Probability curves of 1‐year ACR‐free time for LTr based on pretransplant percentages of (a) activated CD4+CD154+ T cells and (b) activated CD8+CD154+ T cells. This demonstrates that a significant increase in ACR is associated with liver patients having percentages of activated CD3+ T cell subsets out of range for the calculated cut‐off values by ROC analysis. Groups were compared for 12 months as end‐point. ACR = acute cellular rejection; LTr = liver transplant recipients.
