
Fig. 6.
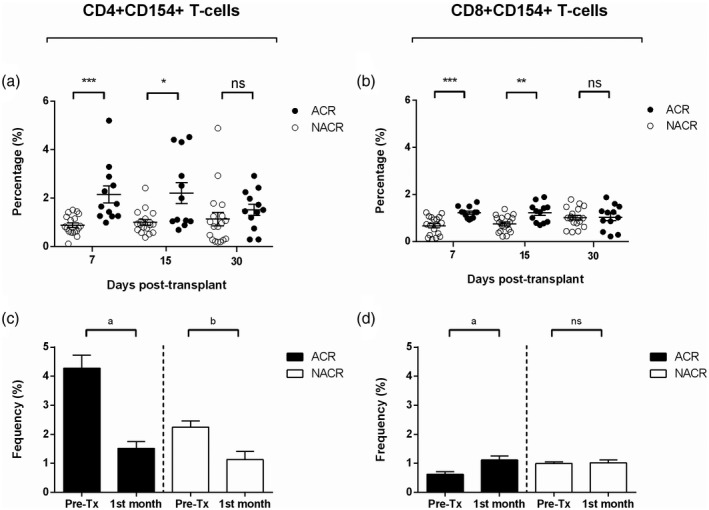
Post‐transplant monitoring of CD4+CD154+ and CD8+CD154+ T cells in LTr with and without ACR. (a) Percentages of CD4+CD154+ T cells between both study groups; black dots refer to ACR and white dots refer to NACR. (b) Percentages of CD8+CD154+ T cells between both study groups; black dots refer to ACR and white dots refer to NACR. (c) Differences in the percentage of CD4+CD154+ T cells between pretransplant and 1 month post‐transplantation; black bars refer to ACR and white bars refer to NACR. (d) Differences in the percentage of CD8+CD154+ T cells between pretransplant and 1 month post‐transplantation; black bars refer to ACR and white bars refer to NACR. ACR = acute cellular rejection; NACR = non‐acute cellular rejection; pre‐Tx = pretransplant· *P ≤ 0·05, **P ≤ 0·01, ***P ≤ 0·001. Differences in the percentage of both activated CD3+ T cell subsets at 7, 15 and 30 days post‐transplantation were analysed by two‐sided Mann–Whitney test, where P ≤ 0·05 was considered statistically significant. a P ≤ 0·05, b P ≤ 0·01. Differences in the percentage of both activated CD3+ T cell subsets between pr–transplant and 1 month post‐transplantation were analysed by two‐sided Wilcoxon’s test, where P ≤ 0·05 was considered statistically significant.