Figure 1.
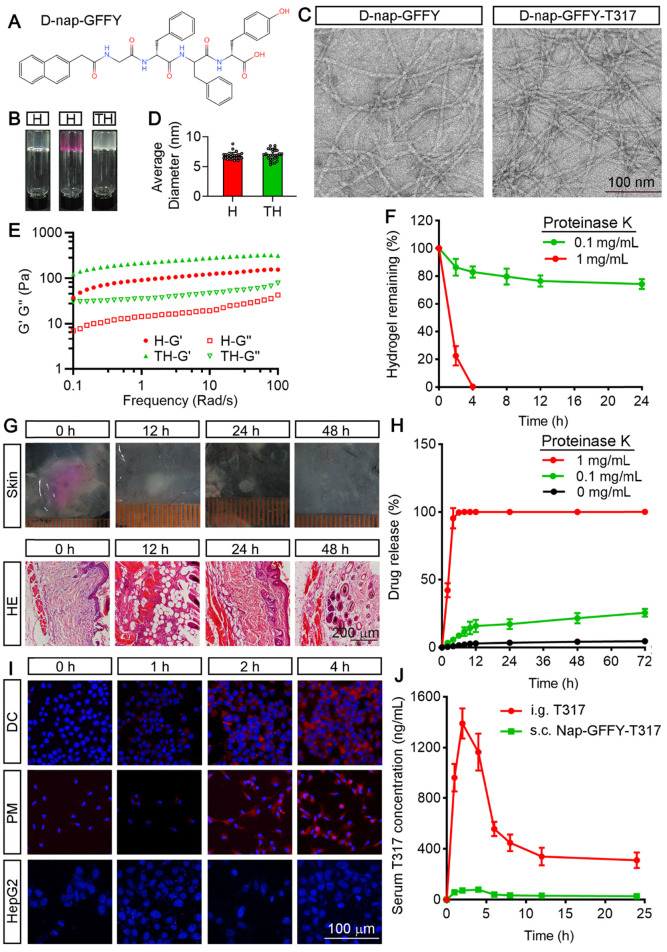
Characterization of D-Nap-GFFY/D-Nap-GFFY-T317 and determination of T317 release from D-Nap-GFFY-T317. (A) chemical structure of D-Nap-GFFY. (B) photographs of D-Nap-GFFY hydrogel prepared with PBS (H) and DMEM medium (H with red color), D-Nap-GFFY-T317 hydrogel prepared with PBS (TH). (C) the representative TEM images of D-Nap-GFFY and D-Nap-GFFY-T317. (D) the average diameters of D-Nap-GFFY and D-Nap-GFFY-T317 were calculated based on TEM images. (E) dynamic frequencey sweep of D-Nap-GFFY and D-Nap-GFFY-T317. (F) degradation behavior of D-Nap-GFFY under different proteinase K concentrations in vitro. (G) C57BL/6 mice were s.c. injected 100 μL D-Nap-GFFY. At the different time points after injection, mice were euthanized and the skin samples of injection site were collected, followed by photography and preparation of sections for HE staining. (H) the release profiles of T317 from D-Nap-GFFY-T317 in the presence of proteinase K at different concentrations in vitro. (I) DCs, peritoneal macrophages and HepG2 cells were added with D-Nap-GFFY-NR and incubated for the indicated times. After washing with PBS, accumulated D-Nap-GFFY-NR within cells were determined by a fluoresent microscopy. Scale bar: 100 μm. (J) C57BL/6 mice (n = 3) were i.g. administrated T317 solution at 10 mg/kg bodyweight or s.c. injected D-Nap-GFFY-T317 at the same T317 dose. After treatment, mice were sacrificed at the indicated time points and blood samples were collecetd for determination of T317 concentrations by LC-MS.

