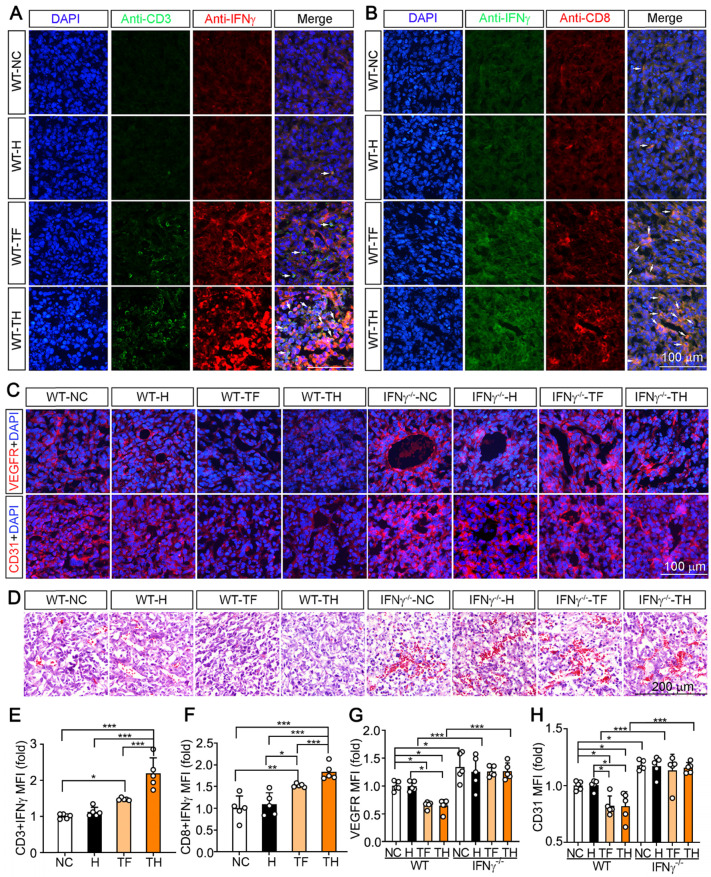
Figure 4.
D-Nap-GFFY-T317 induces T lymphocyte IFNγ expression and suppresses angiogenesis. The tumor sections from WT mice used in Figure 2B-D were conducted co-immunofluorescent staining with anti-IFNγ and CD3 (for T lymphocytes, A) or CD8 (for CTLs, B) antibodies. The white arrows indicate IFNγ expressing T lymphocytes or CTLs. (C) VEGFR or CD31 expression in tumor sections were determined by immunofluorescent staining with anti-VEGFR or CD31 antibody. (D) HE staining of tumor sections. (E-H) the statistical results of mean fluorescent intensity (MFI) in images of (A-C) were quantified. *P < 0.05; **P < 0.01; ***P < 0.001 as indicated (n = 5).

