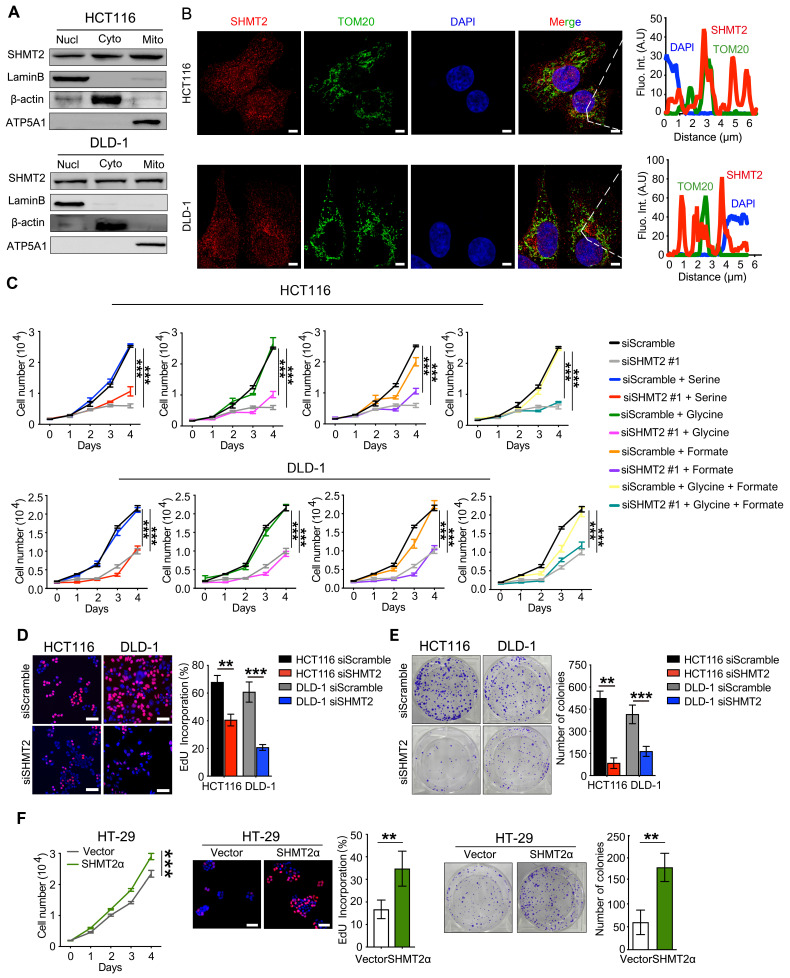
Figure 1.
SHMT2 is located in the cytoplasm and nucleus in addition to the mitochondria in human CRC cells and promotes cells proliferation. (A) Cytoplasmic, mitochondrial, and nuclear fractions of human CRC cells were prepared, and western blot analysis was performed to detect SHMT2 expression. (Lamin B1: nuclear marker; β-actin: cytoplasmic marker; ATP5A1: mitochondrial marker). (B) Representative immunofluorescence images (left) of SHMT2 in HCT116 and DLD-1 cells. Merged images represent overlays of TOM20 (green), SHMT2 (red), and the nucleus (stained by DAPI, blue). The fluorescence intensities (right) of each pixel along the white lines crossing the cells were calculated to show the incomplete colocalization of SHMT2 with TOM20. Scale bar, 5 μm. (C) Cell proliferation was detected by CCK8 assay after SHMT2 knockdown with or without 400 μM serine, 400 μM glycine, or 1mM formate supplementation (n = 3). *** p < 0.001; ordinary one-way ANOVA multiple comparisons test. (D) - (E) Representative images (left) and quantification (right) of EdU incorporation assay (D) (n = 5) and colony formation assay (E) (n = 3) using HCT116 and DLD-1 cells with SHMT2 knockdown. Scale bar, 50 μm. ** p < 0.01, *** p < 0.001; Student's t-test. (F) Representative images and quantification of cell proliferation (left) (n = 3), EdU incorporation assay (middle) (n = 5) and colony formation assay (right) (n = 3) in HT29 cells with SHMT2α overexpression. Scale bar, 50 μm. ** p < 0.01, *** p < 0.001; Student's t-test. The data are presented as the mean ± SD from at least three independent experiments. The error bars show the SD.

