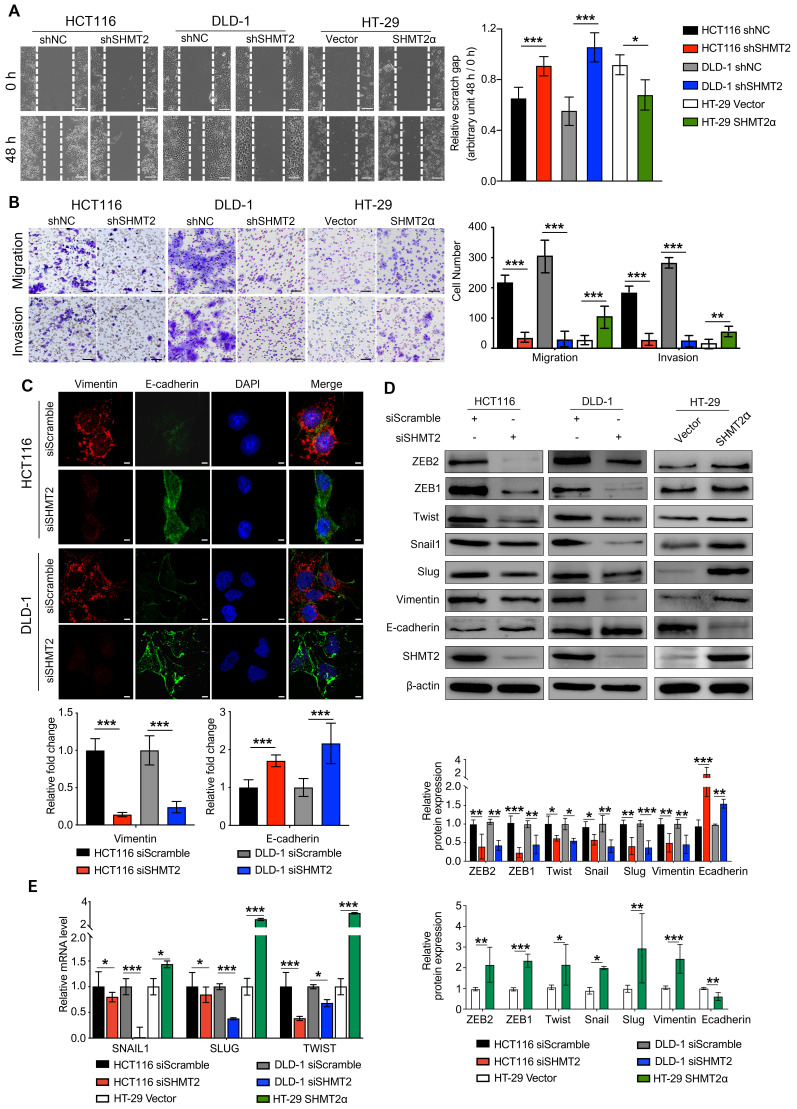
Figure 2.
SHMT2 promotes the migration and invasion of CRC cells in vitro.(A) Representative images (left) and quantification (right) of the wound healing assay using CRC cells with SHMT2 knockdown or SHMT2α overexpression (n = 3). Scale bar, 200 μm. * p < 0.05, *** p < 0.001; Student's t-test. (B) Representative images (left) and quantification (right) of the migration and invasion assay using CRC cells with SHMT2 knockdown or SHMT2α overexpression (n = 3). Scale bar, 100 μm. ** p < 0.01, *** p < 0.001; Student's t-test. (C) Representative immunofluorescence images (up) and quantification (down) of vimentin and E-cadherin in CRC cells. Merged images represent overlays of vimentin (red), E-cadherin (green), and nucleus (blue). Scale bar, 5 μm. *** p < 0.001; Student's t-test. (D) Western blot analysis (up) and quantification (down) of vimentin, E-cadherin, and EMT-associated transcription factors in CRC cells after SHMT2 knockdown or SHMT2α overexpression. * p < 0.05, ** p < 0.01, *** p < 0.001; Student's t-test. (E) RT-qPCR analysis of EMT-associated transcription factors in CRC cells after SHMT2 knockdown or SHMT2α overexpression (n = 3). * p < 0.05, *** p < 0.001; Student's t-test. The data are presented as the mean ± SD from at least three independent experiments. The error bars show the SD.

