Figure 7.
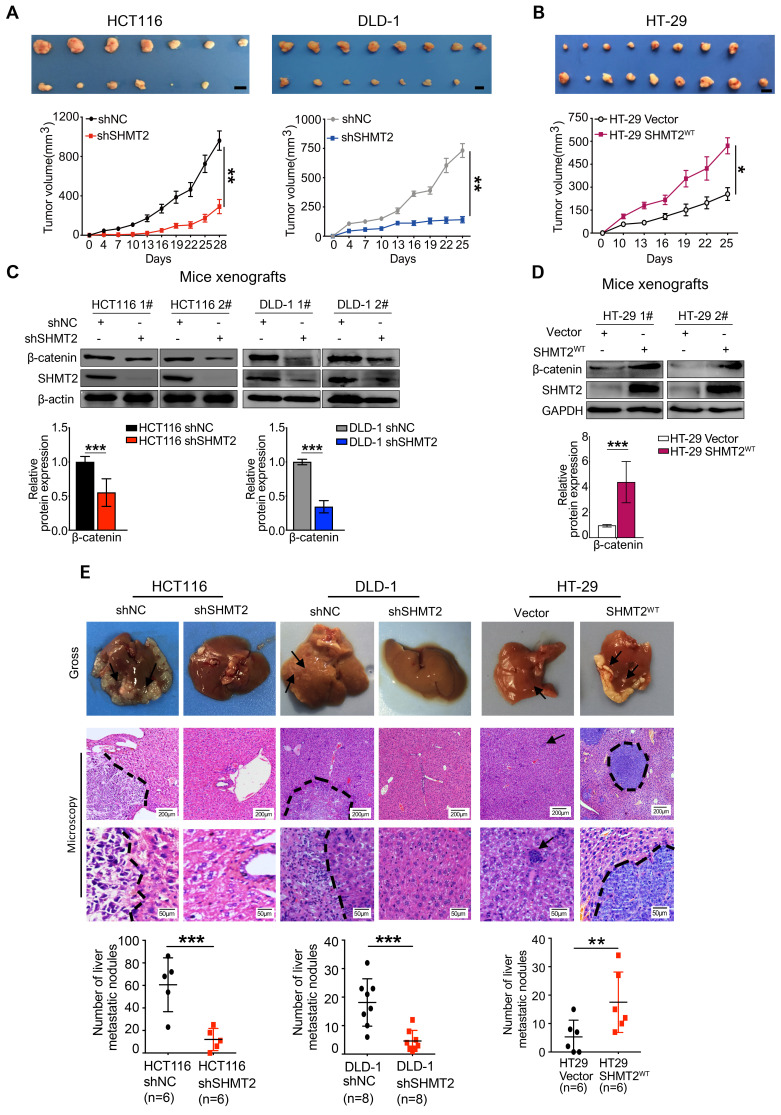
SHMT2 promotes CRC cell growth and metastasis in vivo.(A) Representative images (up) and growth curves (down) of xenograft experiments using HCT116 (n = 7) and DLD-1 (n = 8) cells with SHMT2 knockdown (6-8 per group). Scale bar, 1 cm. * p < 0.05, ** p < 0.01; Student's t-test. The data are presented as the mean ± SEM from two independent experiments. The error bars show the SEM. (B) Representative images (up) and growth curve (down) of xenograft experiments using HT-29 cells with SHMT2WT overexpression (n = 9). Scale bar, 1 cm. * p < 0.05, ** p < 0.01; Student's t-test. The data are presented as the mean ± SEM from two independent experiments. The error bars show the SEM. (C) Western blot analysis (top) and quantification (bottom) of SHMT2 and β-catenin in xenograft tumors from HCT116 and DLD-1 cells with SHMT2 knockdown. *** p < 0.001; Student's t-test. The data are presented as the mean ± SD from two independent experiments. The error bars show the SD. (D) Western blot analysis (top) and quantification (bottom) of SHMT2 and β-catenin in xenograft tumors from HT-29 cells with SHMT2WT overexpression. *** p < 0.001; Student's t-test. The data are presented as the mean ± SD from two independent experiments. The error bars show the SD. (E) Representative gross (up) and microscopic (middle) images and the numbers of liver metastasis nodules (bottom) in an intrasplenic-nude mouse model of CRC cells with SHMT2 knockdown or overexpression. After 6 weeks, the mice were killed and the liver tissues were stained with H&E. The number of liver metastasis nodules was counted and statistically analyzed (n = 6-8 per group). Scale bar, 200 μm or 50 μm. ** p < 0.01, *** p < 0.001; Student's t-test. The data are presented as the mean ± SD from two independent experiments. The error bars show the SD.

