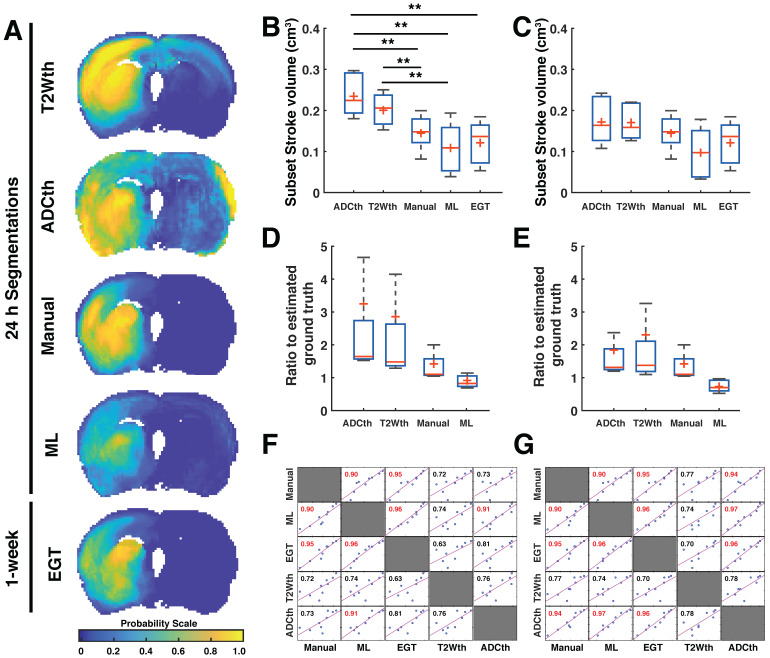
Fig 3.
Stroke volume comparisons for subset of animals validated with ground truth. The data from the 24 h volume predictions belonging only to the subset of animals studied with MRI after 1 week is shown in the figure (A). The joint probability map of all the animals per group (n=9) are shown for all segmentation methods. This visualitation shows the consistency of stroke location on the territory of the middle cerebral artery. In this way, it is clear that apparent diffusion coefficient thresholding (ADCth) and T2-weighted image thresholding (T2Wth) largely overestimate stroke and misclasify areas in the contralateral hemisphere to the artery occlusion in comparison to the machine learning (ML) predictions, Manual segmentation (Manual) and estimated ground truth (EGT). (B). The boxplot graph the voxels classified as stroke on both hemispheres using the different segmentation approaches. ANOVA found significant differences between the groups (P<0.01) with both thresholding methods being significantly larger than ML and EGT (B). Shows the same data as the previous boxplot excluding the voxels from the contralateral hemisphere, further emphasizing the benefit obtained by the thresholding approaches by removal of the affected hemisphere. Significant differences were found in ANOVA (P=0.03), though bonferroni correction found no specific differences between the groups. (C). The boxplots show the ratio of the volumes to the EGT. In this case, no significant differences between the groups were found. (D). Evaluation of the ratio to the EGT as in panel C, without the contralateral hemisphere showed similarly no significant differences. (E). Correlation matrix of the stroke volume predictions using the different segmentation approaches using data from both brain hemispheres. Every data point represents the stroke volume of one animal. Most important of all is the comparison of the different methods to the EGT. Manual and ML segmentations were found to have the strongest correlations to EGT. ADCth and ML correlate strongly, which denotes the importance of ADC in the ML framework. Also noteworthy is that T2Wth and ADCth do not independently present a stronger correlation to the EGT than Manual or ML. (F). This correlation matrix is analogus to panel E except that contralateral hemisphere voxels are excluded. The ML volumes change only slightly and the correlation to EGT remains the same. The Manual approach does not change, since the experimenter segmented only the ipsilateral stroke hemisphere. T2Wth profits from the removal of the contralateral hemisphere, while ADCth dramatically increases its correlation to EGT. Pearson's correlations shown in red symbolize a P-value < 0.0001. The boxplots present several metrics in symbols: Mean (+), median (red line), 1st quartile of the data (box upper border), 3rd quartile of the data (box lower border) and 15% outmost border of the dataset (whisker). *P<0.05, **P<0.01.

