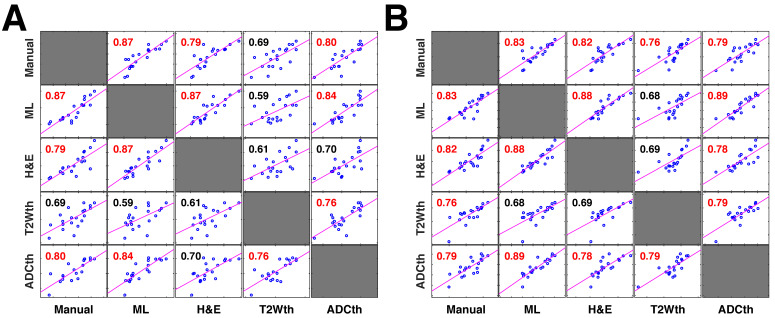
Fig 4.
Correlation plots of all stroke volume quantification methods to 1-week histology. The correlation matrices show the relationship between the stroke volume measured by the different segmentation approaches in MRI and their relationship to the area directly measured by pathologists in 1-week histology (n=20 per comparison) (A). In this comparison the entire stroke volume measured in MRI was compared to the single histology area. Both the machine learning (ML) and Manual ROI stroke volumes have a strong correlation to the corresponding H&E areas. In comparison, thresholding approaches using apparent diffusion coefficient (ADCth) and T2 weighted images (T2Wth) show poor correlations. These correlation relationships are similar to the ones in Fig. 3E and 3F, however, this analysis contains a larger data sample. Here, ADCth once again shows a strong correlation to the ML predictions; also ADCth and T2Wth by themselves do not correlate strongly to H&E. (B). In this comparison only one slice of the MRI Volume per animal with corresponding H&E slice (or ground truth) was used to calculate the correlations. This approach provides the best comparison between the methodologies. Here, it can be observed that ADCth correlates strongly to the ML prediction and to the H&E. Pearson's correlations shown in red color have a p-value < 0.0001.

