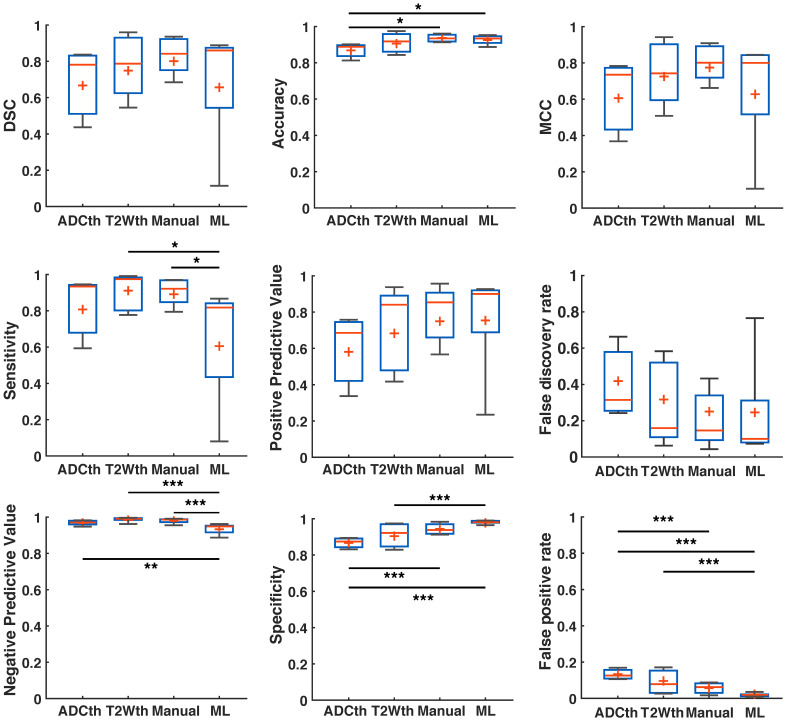
Fig 6.
Metrics detailing stroke volume (SV) prediction in preclinical data. The boxplots present several measures in symbols: Mean (+), median (red line), 1st quartile of the data (box upper border), 3rd quartile of the data (box lower border) and 15% outmost border of the dataset (whisker). Dice similarity coefficient (DSC), Mathew's correlation coefficient (MCC), positive predictive value, false discovery rate showed no significances in ANOVA. The median values, however, are slightly increased in the ML group in comparison to that of the other groups, except in false discovery rate where it the median is the lowest. ANOVA showed significant differences in the metrics of accuracy, sensitivity, negative predictive value, specificity and false positive rate. Here, for the most part ML and Manual segmentation significantly outperformed thresholding methods. Sensitivity is significantly reduced for the ML group in comparison to the thresholding methods. *P<0.05, **P<0.01.

