Fig 7.
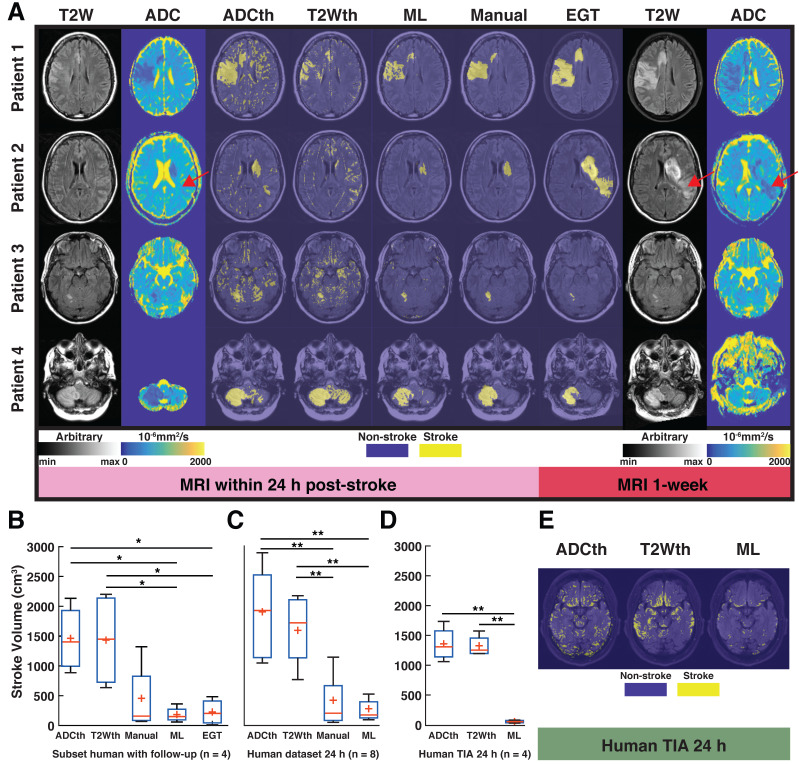
Human translation examples. All the different segmentations approaches and stroke volume quantifications are shown. (A). The main figure shows images the four patients with ischemic stroke with MRI follow-up at 1-week post stroke. The left panel shows the 24 h MRI and the different segmentations performed while the right panel shows the estimated ground truth (EGT) and follow up MRI. T2-weighted (T2W) images and apparent diffusion coefficient (ADC) maps are shown with slices corresponding to ADC and T2 thresholding (ADCth and T2Wth), machine learning (ML) and Manual segmentations. The first example shows a stroke delimited to the right hemisphere in ADC and T2W images. For the most part there is good correspondance between ML, Manual segmentation and EGT. Except, for the second patient which presented a novel stroke region sometime after the scan (red arrow). (B). ANOVA showed that the quantification of the stroke volume of the subset of patients was significantly different between the segmentation approaches (P<0.01), especifically the thresholding approaches overestimated the stroke volumes in comparsion to ML and EGT. (C). The evaluation of the 24 h stroke volume quantification using all studied stroke patients (n=8) also yielded significant differences using ANOVA (P<0.001). Here, Manual segmentation was also significantly different to the thresholding approaches. (B). Finally, ANOVA (P<0.001) showed that the evaluation of patients with transient ischemic attack (TIA - no stroke region in MRI), presented significantly more false positive stroke regions using thresholding approaches than ML. *P<0.05, **P<0.01.

