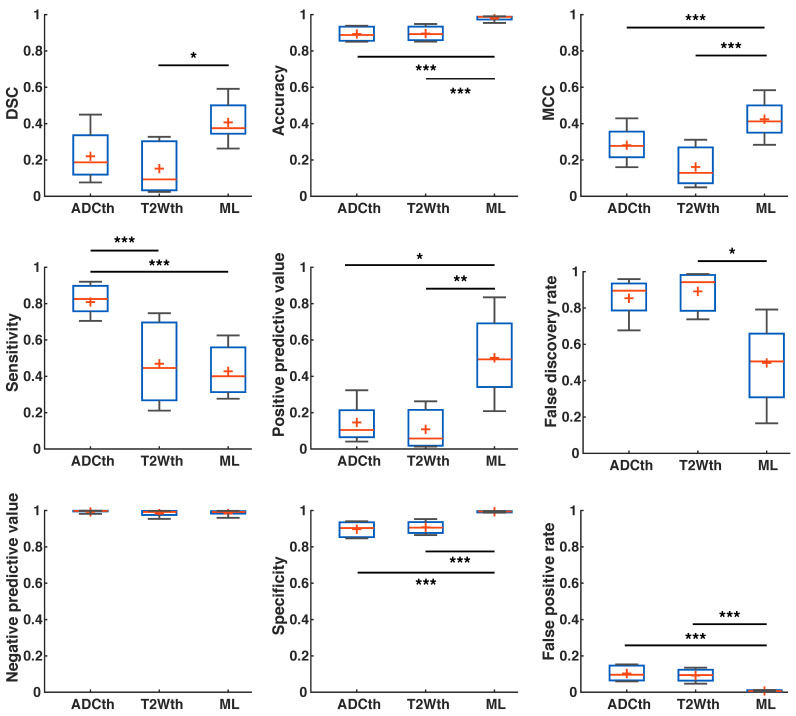
Fig 8.
Joint probability maps. The overlay of the strokes of every animal per group are shown as a probability of stroke occurrence for ease of visualization as depicted in the probability scale. Here, it is clear that apparent diffusion coefficient thresholding (ADCth) and T2-weighted image thresholding (T2Wth) largely overestimate stroke and misclasify areas in the contralateral hemisphere in comparison to the machine learning (ML) predictions. At the same time the consistency of stroke location on the territory of the middle cerebral artery can be observed.

