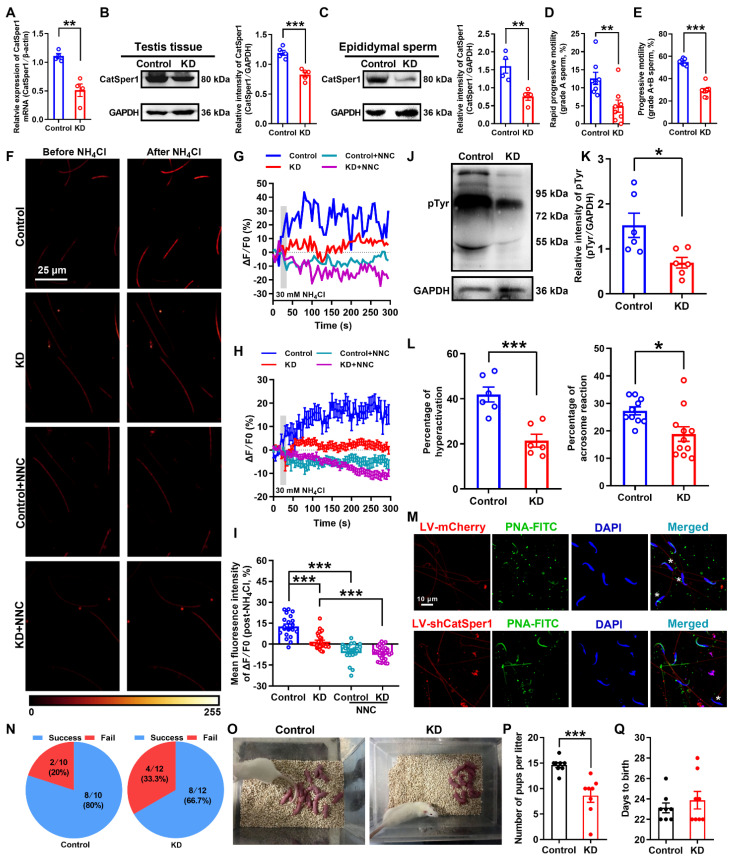
Figure 4.
Reduced sperm motility and functional characteristics, and impaired fertility in CatSper1 knockdown rats. (A-C) Validation of CatSper1 knockdown (KD) in both testis tissues and epididymal sperm in rats treated with lentivirus-containing CatSper1 shRNA (LV-shCatSper1) by RT-qPCR (A) and Western blotting (B-C) (n = 4-5 rats per group). (D-E) Sperm motility including grade A sperm (D) and grade A+B sperm (E) (n = 8 rats per group). (F) Representative fluorescence images from Fluo-4 loaded sperm before and after 30 mM NH4Cl treatment in different groups as indicated. Scale bar = 25 μm. (G) Representative single sperm fluorescence traces. (H) Changes in normalized [Ca2+]i fluorescent signals of all tested sperm. (I) Summary plot of normalized [Ca2+]i fluorescent signals of all tested sperm in response to NH4Cl treatment (n = 21-30 spermatozoa from 4 rats per group). (J-M) Protein tyrosine phosphorylation (pTyr), hyperactivation, and acrosome reaction (AR) in the epididymal sperm of KD and control rats. A summary plot for the percentage of sperm acrosome reaction (L) and representative images of sperm acrosome reaction (M) of KD and control rats are shown (n = 6 rats per group). Asterisk indicates the sperm that has acrosome reaction (acrosome disappeared). Scale bar = 10 μm. (N-Q) In vivo fertility assay of KD and control rats (n = 6 male rats per group). (N) Summary plot of the pregnancy rate of female rats that were mated with KD and control rats. (O-P) Representative and a summary plot for number of pups per litter. (Q) Days to birth of the pup. All data are presented as mean ± SEM. *P < 0.05, **P < 0.01, ***P < 0.001. Unpaired t test for (A)-(E), (K)-(L), and (P)-(Q); one-way ANOVA with Sidak's post-hoc test for (I). See also Figures S5-S8.

