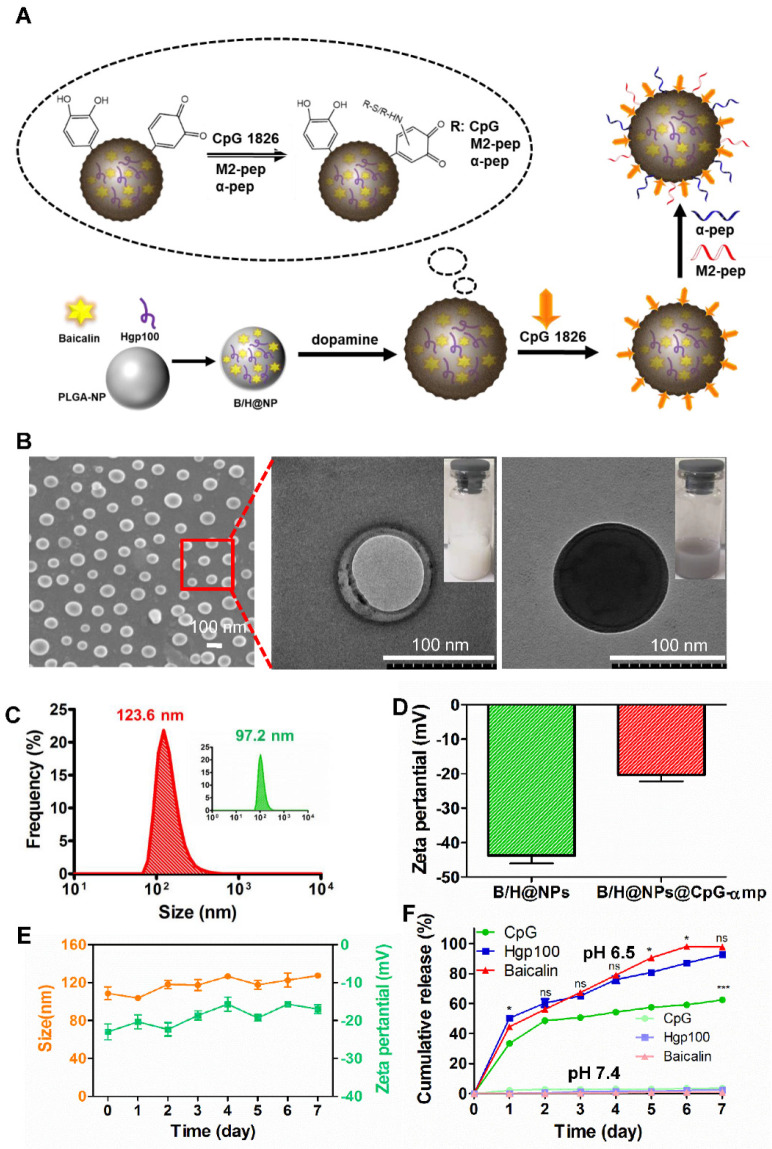
Figure 1.
Preparation and characterization of the PLGA nano-complexes. (A) Schematic illustration of the PLGA nano-complexes preparation steps. (B) SEM and TEM images of the nano-complexes: NPs and pD@NPs, scale bar = 100 nm. (C) Size distributions of the nano-complexes: NPs and pD@NPs in pH 7.4 PBS. (D) Zeta potential of nano-complexes: NPs and pD@NPs in pH 7.4 PBS. (E) Variations of average size and zeta potential of nano-complexes: B/H@NPs@CpG-αmp in pH 7.4 PBS over 7 days. (F) Payload release profiles of nano-complexes: B/H@NPs@CpG-αmp in pH 6.5 and pH 7.4 PBS at 37°C over 7 days. The “*” is for Baicalin vs Hpg100; the “ns” is for Baicalin vs Hpg100, and the “***” is for Baicalin vs CpG, or Hpg100 vs CpG. Data are expressed as the mean ± standard error of the mean (SEM), n = 3. Differences between two groups were tested using an unpaired, two-tailed Student's t-test. Differences among multiple groups were tested with one-way ANOVA followed by Tukey's multiple comparison. Significant differences between groups are expressed as follows: *P < 0.05, **P < 0.01, or ***P < 0.001.

