Figure 4.
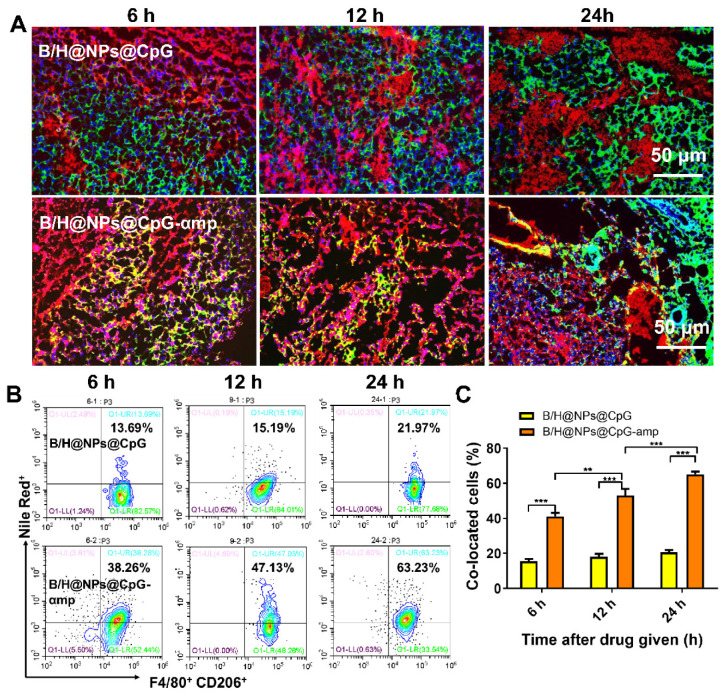
Evaluation of nano-complexes of B/H@NPs@CpG-αmp for in vivo targeting of M2-like TAMs. (A) Representative immunofluorescence images for detection of F4/80+ and CD206+ TAM targets using B/H@NPs@CpG and B/H@NPs@CpG-αmp nano-complexes at 6 h, 12 h, 24 h after treatment. Yellow color represents co-localization of nano-complexes and TAMs. Blue: cell nucleus, red: nano-complex, green: CD206+ TAMs. Scale bar: 50 µm. (B, C) Quantitative analysis of B/H@NPs@CpG and B/H@NPs@CpG-αmp targeting to F4/80+, CD206+ TAMs by flow cytometry. Three independent experiments were analyzed in every group, n = 3. Data are expressed as the mean ± standard error of the mean (SEM). Differences between two groups were tested using an unpaired, two-tailed Student's t-test. Differences among multiple groups were tested with one-way ANOVA followed by Tukey's multiple comparison. Significant differences between groups are expressed as follows: *P < 0.05, **P < 0.01, or ***P < 0.001.

