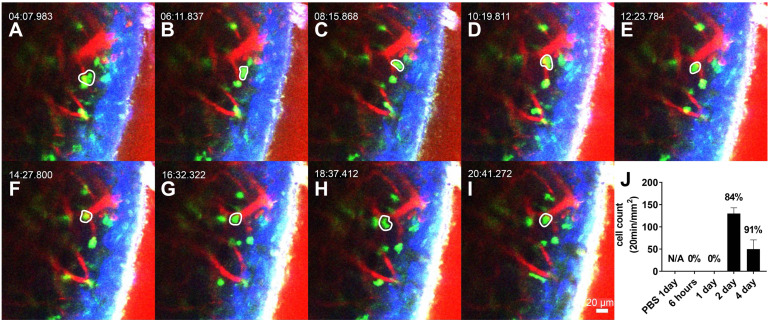
Figure 3.
Interstitial migrating neutrophils in the spiral ligament 2 days after middle ear inoculation with LPS. (A-I) Intravital image of the cochlear lateral wall in the LysM-GFP+/- mouse shows serial time lapse of a migrating cell (white-lined polygon). The images were obtained after i.v. injection of Texas Red-dextran. The green region shows LysM-GFP positive cells. The red region shows blood vessels stained with Texas Red-dextran. Blue region shows the second harmonic generation of cortical bone by lasers. Scale bar = 20 µm. Time interval = 2 min. (J) Quantification of the interstitial migrating cells. The percentage above the graph indicates interstitial migrating neutrophil fraction calculated as the number of interstitial migrating neutrophils divided by the total number of intravascular crawling neutrophils and interstitial migrating cells.

